Immigrants from Jordan vs Cree In Labor Force | Age 35-44
COMPARE
Immigrants from Jordan
Cree
In Labor Force | Age 35-44
In Labor Force | Age 35-44 Comparison
Immigrants from Jordan
Cree
84.4%
IN LABOR FORCE | AGE 35-44
52.5/ 100
METRIC RATING
170th/ 347
METRIC RANK
82.0%
IN LABOR FORCE | AGE 35-44
0.0/ 100
METRIC RATING
309th/ 347
METRIC RANK
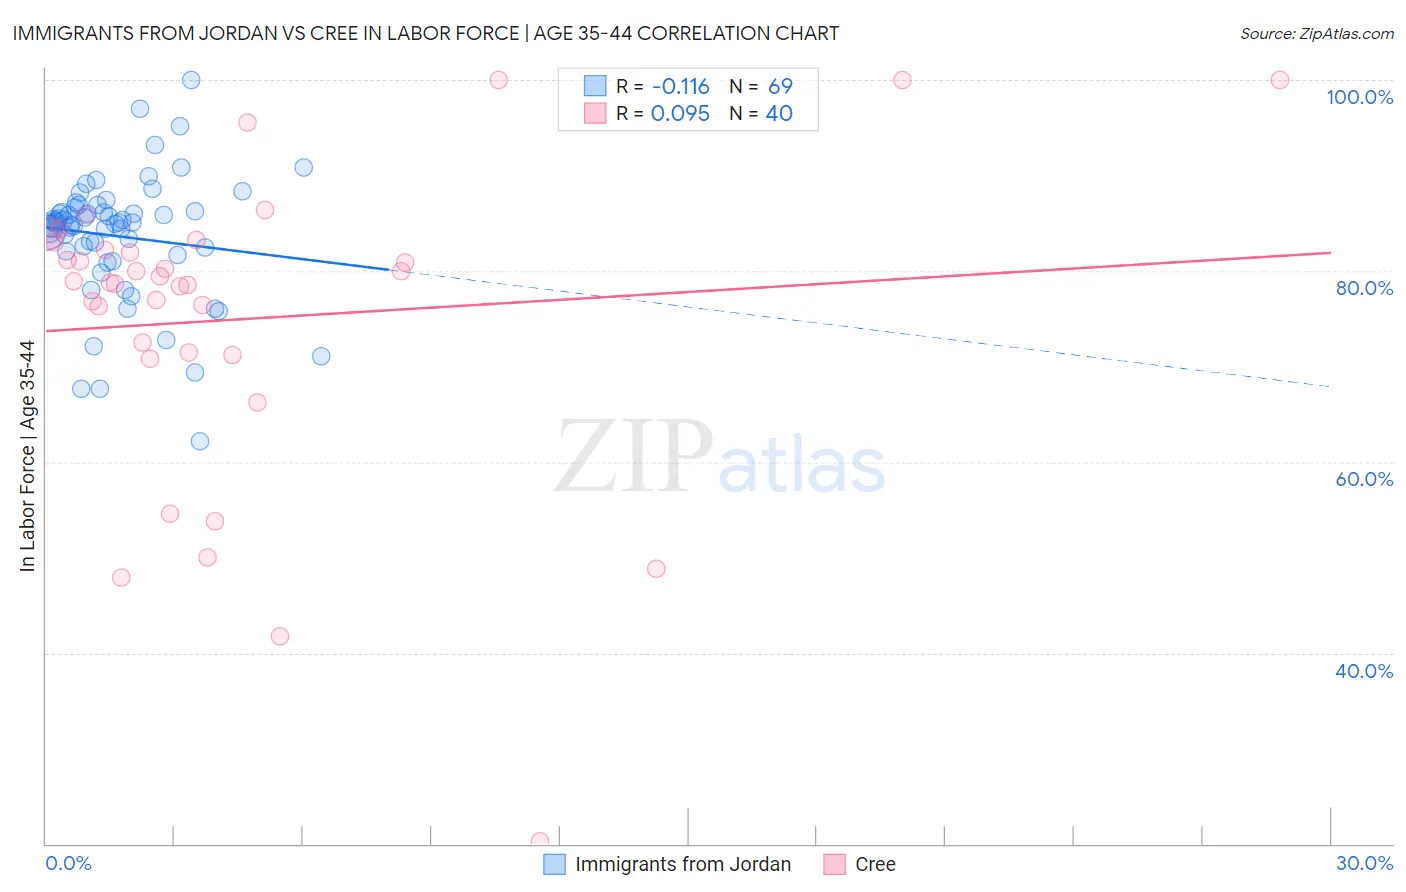
Immigrants from Jordan vs Cree In Labor Force | Age 35-44 Correlation Chart
The statistical analysis conducted on geographies consisting of 181,251,631 people shows a poor negative correlation between the proportion of Immigrants from Jordan and labor force participation rate among population between the ages 35 and 44 in the United States with a correlation coefficient (R) of -0.116 and weighted average of 84.4%. Similarly, the statistical analysis conducted on geographies consisting of 76,208,186 people shows a slight positive correlation between the proportion of Cree and labor force participation rate among population between the ages 35 and 44 in the United States with a correlation coefficient (R) of 0.095 and weighted average of 82.0%, a difference of 2.9%.
In Labor Force | Age 35-44 Correlation Summary
| Measurement | Immigrants from Jordan | Cree |
| Minimum | 62.1% | 20.3% |
| Maximum | 100.0% | 100.0% |
| Range | 37.9% | 79.7% |
| Mean | 83.6% | 74.9% |
| Median | 85.0% | 78.9% |
| Interquartile 25% (IQ1) | 81.9% | 71.3% |
| Interquartile 75% (IQ3) | 86.5% | 82.6% |
| Interquartile Range (IQR) | 4.6% | 11.3% |
| Standard Deviation (Sample) | 6.6% | 16.3% |
| Standard Deviation (Population) | 6.6% | 16.1% |
Similar Demographics by In Labor Force | Age 35-44
Demographics Similar to Immigrants from Jordan by In Labor Force | Age 35-44
In terms of in labor force | age 35-44, the demographic groups most similar to Immigrants from Jordan are Irish (84.4%, a difference of 0.0%), Immigrants from Afghanistan (84.4%, a difference of 0.0%), Jordanian (84.4%, a difference of 0.0%), Scandinavian (84.4%, a difference of 0.010%), and Immigrants from Trinidad and Tobago (84.4%, a difference of 0.010%).
| Demographics | Rating | Rank | In Labor Force | Age 35-44 |
| Aleuts | 59.1 /100 | #163 | Average 84.4% |
| Nigerians | 58.9 /100 | #164 | Average 84.4% |
| Venezuelans | 58.1 /100 | #165 | Average 84.4% |
| Alsatians | 55.2 /100 | #166 | Average 84.4% |
| Immigrants | Portugal | 55.2 /100 | #167 | Average 84.4% |
| Irish | 53.1 /100 | #168 | Average 84.4% |
| Immigrants | Afghanistan | 52.7 /100 | #169 | Average 84.4% |
| Immigrants | Jordan | 52.5 /100 | #170 | Average 84.4% |
| Jordanians | 51.7 /100 | #171 | Average 84.4% |
| Scandinavians | 51.2 /100 | #172 | Average 84.4% |
| Immigrants | Trinidad and Tobago | 50.7 /100 | #173 | Average 84.4% |
| Immigrants | Iran | 50.0 /100 | #174 | Average 84.4% |
| Pakistanis | 48.2 /100 | #175 | Average 84.4% |
| Sri Lankans | 47.3 /100 | #176 | Average 84.4% |
| French Canadians | 44.3 /100 | #177 | Average 84.3% |
Demographics Similar to Cree by In Labor Force | Age 35-44
In terms of in labor force | age 35-44, the demographic groups most similar to Cree are Immigrants from Central America (82.0%, a difference of 0.0%), Blackfeet (81.9%, a difference of 0.12%), Hispanic or Latino (82.1%, a difference of 0.15%), Black/African American (82.2%, a difference of 0.25%), and Shoshone (82.2%, a difference of 0.27%).
| Demographics | Rating | Rank | In Labor Force | Age 35-44 |
| Americans | 0.0 /100 | #302 | Tragic 82.4% |
| Nepalese | 0.0 /100 | #303 | Tragic 82.4% |
| Marshallese | 0.0 /100 | #304 | Tragic 82.4% |
| Shoshone | 0.0 /100 | #305 | Tragic 82.2% |
| Blacks/African Americans | 0.0 /100 | #306 | Tragic 82.2% |
| Hispanics or Latinos | 0.0 /100 | #307 | Tragic 82.1% |
| Immigrants | Central America | 0.0 /100 | #308 | Tragic 82.0% |
| Cree | 0.0 /100 | #309 | Tragic 82.0% |
| Blackfeet | 0.0 /100 | #310 | Tragic 81.9% |
| Colville | 0.0 /100 | #311 | Tragic 81.7% |
| Alaska Natives | 0.0 /100 | #312 | Tragic 81.6% |
| Mexicans | 0.0 /100 | #313 | Tragic 81.6% |
| Cajuns | 0.0 /100 | #314 | Tragic 81.5% |
| Immigrants | Mexico | 0.0 /100 | #315 | Tragic 81.5% |
| Comanche | 0.0 /100 | #316 | Tragic 81.5% |