Somali vs Immigrants from Mexico In Labor Force | Age 35-44
COMPARE
Somali
Immigrants from Mexico
In Labor Force | Age 35-44
In Labor Force | Age 35-44 Comparison
Somalis
Immigrants from Mexico
85.6%
IN LABOR FORCE | AGE 35-44
100.0/ 100
METRIC RATING
13th/ 347
METRIC RANK
81.5%
IN LABOR FORCE | AGE 35-44
0.0/ 100
METRIC RATING
315th/ 347
METRIC RANK
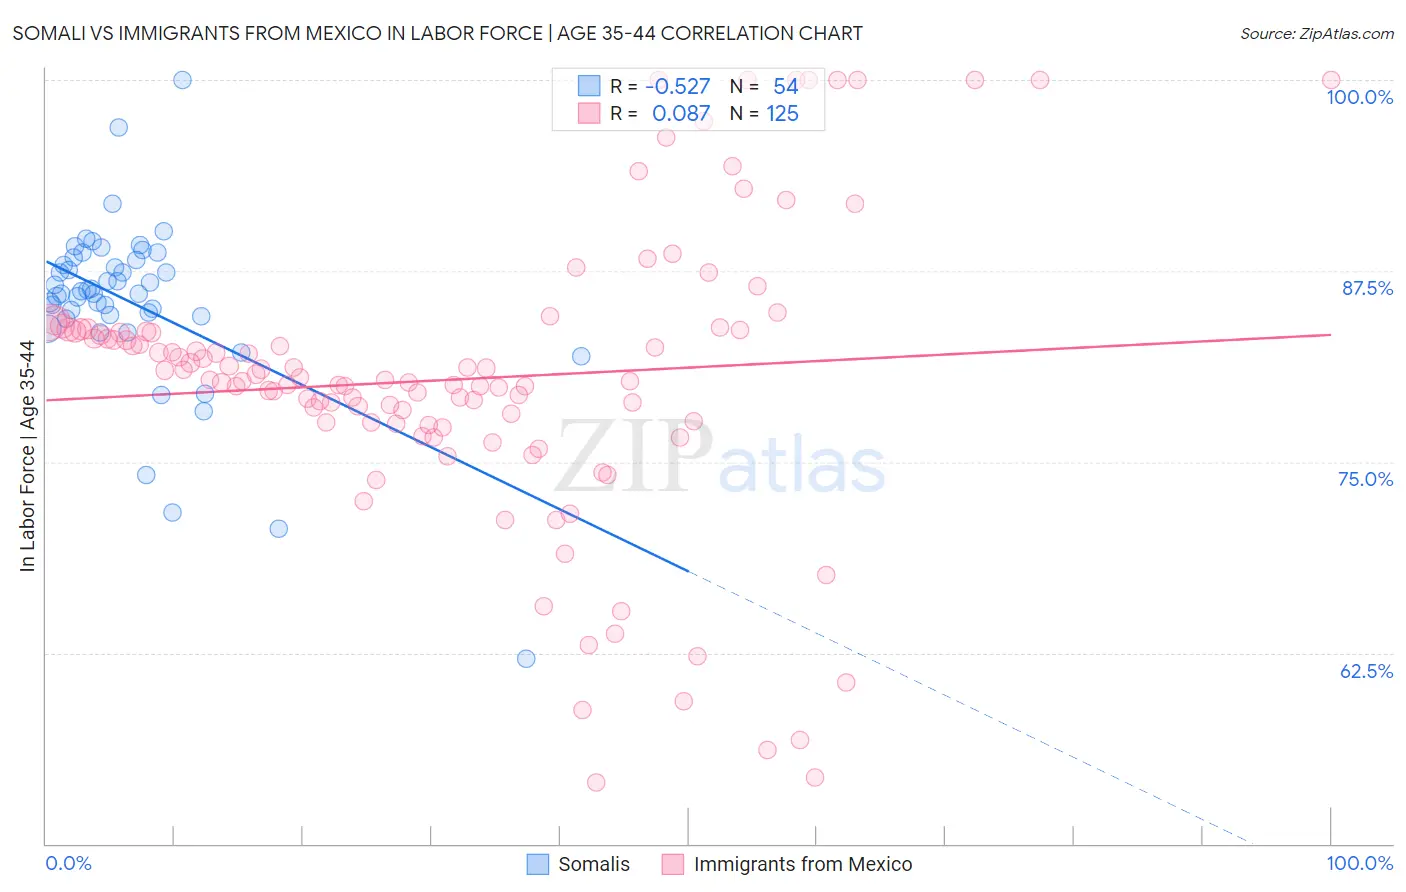
Somali vs Immigrants from Mexico In Labor Force | Age 35-44 Correlation Chart
The statistical analysis conducted on geographies consisting of 99,300,084 people shows a substantial negative correlation between the proportion of Somalis and labor force participation rate among population between the ages 35 and 44 in the United States with a correlation coefficient (R) of -0.527 and weighted average of 85.6%. Similarly, the statistical analysis conducted on geographies consisting of 513,440,276 people shows a slight positive correlation between the proportion of Immigrants from Mexico and labor force participation rate among population between the ages 35 and 44 in the United States with a correlation coefficient (R) of 0.087 and weighted average of 81.5%, a difference of 5.1%.
In Labor Force | Age 35-44 Correlation Summary
| Measurement | Somali | Immigrants from Mexico |
| Minimum | 62.1% | 54.0% |
| Maximum | 100.0% | 100.0% |
| Range | 37.9% | 46.0% |
| Mean | 85.4% | 80.4% |
| Median | 86.1% | 80.3% |
| Interquartile 25% (IQ1) | 84.5% | 77.5% |
| Interquartile 75% (IQ3) | 88.2% | 83.6% |
| Interquartile Range (IQR) | 3.7% | 6.1% |
| Standard Deviation (Sample) | 5.8% | 9.6% |
| Standard Deviation (Population) | 5.8% | 9.6% |
Similar Demographics by In Labor Force | Age 35-44
Demographics Similar to Somalis by In Labor Force | Age 35-44
In terms of in labor force | age 35-44, the demographic groups most similar to Somalis are Immigrants from Somalia (85.6%, a difference of 0.0%), Liberian (85.7%, a difference of 0.020%), Norwegian (85.6%, a difference of 0.040%), Immigrants from Ireland (85.6%, a difference of 0.040%), and Immigrants from North Macedonia (85.6%, a difference of 0.090%).
| Demographics | Rating | Rank | In Labor Force | Age 35-44 |
| Bolivians | 100.0 /100 | #6 | Exceptional 86.1% |
| Immigrants | Sierra Leone | 100.0 /100 | #7 | Exceptional 86.1% |
| Immigrants | Ethiopia | 100.0 /100 | #8 | Exceptional 85.9% |
| Ethiopians | 100.0 /100 | #9 | Exceptional 85.9% |
| Cape Verdeans | 100.0 /100 | #10 | Exceptional 85.8% |
| Immigrants | Cameroon | 100.0 /100 | #11 | Exceptional 85.8% |
| Liberians | 100.0 /100 | #12 | Exceptional 85.7% |
| Somalis | 100.0 /100 | #13 | Exceptional 85.6% |
| Immigrants | Somalia | 100.0 /100 | #14 | Exceptional 85.6% |
| Norwegians | 100.0 /100 | #15 | Exceptional 85.6% |
| Immigrants | Ireland | 100.0 /100 | #16 | Exceptional 85.6% |
| Immigrants | North Macedonia | 100.0 /100 | #17 | Exceptional 85.6% |
| Carpatho Rusyns | 100.0 /100 | #18 | Exceptional 85.6% |
| Slovenes | 100.0 /100 | #19 | Exceptional 85.6% |
| Immigrants | Serbia | 100.0 /100 | #20 | Exceptional 85.5% |
Demographics Similar to Immigrants from Mexico by In Labor Force | Age 35-44
In terms of in labor force | age 35-44, the demographic groups most similar to Immigrants from Mexico are Cajun (81.5%, a difference of 0.020%), Comanche (81.5%, a difference of 0.020%), Cherokee (81.4%, a difference of 0.10%), Alaska Native (81.6%, a difference of 0.14%), and Mexican (81.6%, a difference of 0.14%).
| Demographics | Rating | Rank | In Labor Force | Age 35-44 |
| Immigrants | Central America | 0.0 /100 | #308 | Tragic 82.0% |
| Cree | 0.0 /100 | #309 | Tragic 82.0% |
| Blackfeet | 0.0 /100 | #310 | Tragic 81.9% |
| Colville | 0.0 /100 | #311 | Tragic 81.7% |
| Alaska Natives | 0.0 /100 | #312 | Tragic 81.6% |
| Mexicans | 0.0 /100 | #313 | Tragic 81.6% |
| Cajuns | 0.0 /100 | #314 | Tragic 81.5% |
| Immigrants | Mexico | 0.0 /100 | #315 | Tragic 81.5% |
| Comanche | 0.0 /100 | #316 | Tragic 81.5% |
| Cherokee | 0.0 /100 | #317 | Tragic 81.4% |
| Alaskan Athabascans | 0.0 /100 | #318 | Tragic 81.3% |
| Inupiat | 0.0 /100 | #319 | Tragic 80.9% |
| Chickasaw | 0.0 /100 | #320 | Tragic 80.9% |
| Puerto Ricans | 0.0 /100 | #321 | Tragic 80.7% |
| Paiute | 0.0 /100 | #322 | Tragic 80.6% |