Slovene vs Brazilian In Labor Force | Age 30-34
COMPARE
Slovene
Brazilian
In Labor Force | Age 30-34
In Labor Force | Age 30-34 Comparison
Slovenes
Brazilians
85.6%
IN LABOR FORCE | AGE 30-34
99.7/ 100
METRIC RATING
52nd/ 347
METRIC RANK
85.4%
IN LABOR FORCE | AGE 30-34
99.1/ 100
METRIC RATING
70th/ 347
METRIC RANK
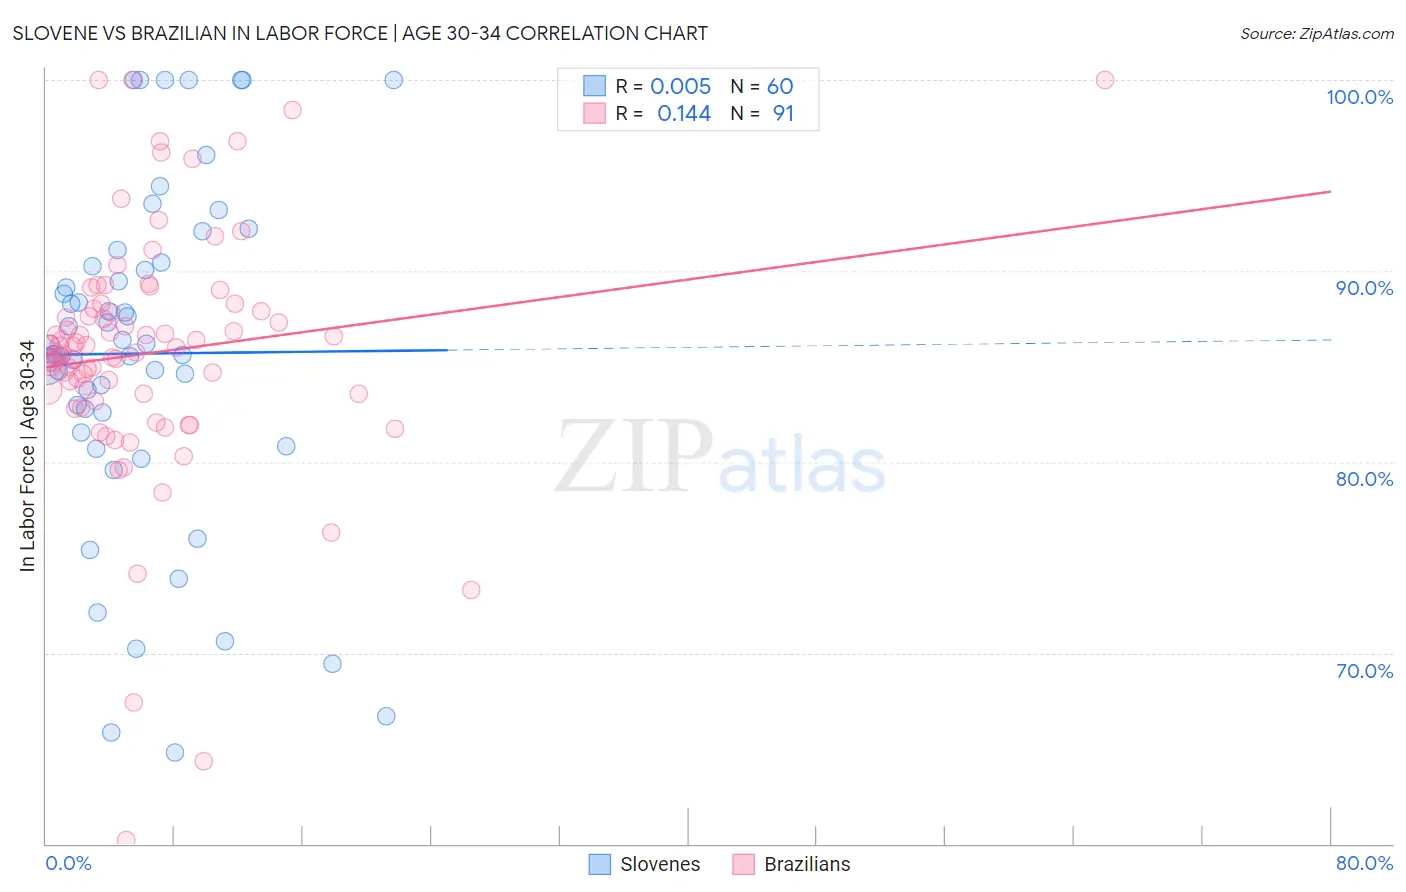
Slovene vs Brazilian In Labor Force | Age 30-34 Correlation Chart
The statistical analysis conducted on geographies consisting of 261,230,340 people shows no correlation between the proportion of Slovenes and labor force participation rate among population between the ages 30 and 34 in the United States with a correlation coefficient (R) of 0.005 and weighted average of 85.6%. Similarly, the statistical analysis conducted on geographies consisting of 323,771,960 people shows a poor positive correlation between the proportion of Brazilians and labor force participation rate among population between the ages 30 and 34 in the United States with a correlation coefficient (R) of 0.144 and weighted average of 85.4%, a difference of 0.21%.
In Labor Force | Age 30-34 Correlation Summary
| Measurement | Slovene | Brazilian |
| Minimum | 64.8% | 60.2% |
| Maximum | 100.0% | 100.0% |
| Range | 35.2% | 39.8% |
| Mean | 85.7% | 85.7% |
| Median | 85.9% | 86.0% |
| Interquartile 25% (IQ1) | 82.1% | 83.6% |
| Interquartile 75% (IQ3) | 90.4% | 88.0% |
| Interquartile Range (IQR) | 8.3% | 4.4% |
| Standard Deviation (Sample) | 8.8% | 6.5% |
| Standard Deviation (Population) | 8.8% | 6.4% |
Demographics Similar to Slovenes and Brazilians by In Labor Force | Age 30-34
In terms of in labor force | age 30-34, the demographic groups most similar to Slovenes are Cape Verdean (85.6%, a difference of 0.010%), Filipino (85.5%, a difference of 0.050%), Immigrants from Kenya (85.5%, a difference of 0.060%), Immigrants from Turkey (85.5%, a difference of 0.060%), and Czech (85.5%, a difference of 0.070%). Similarly, the demographic groups most similar to Brazilians are Immigrants from Japan (85.4%, a difference of 0.0%), Immigrants from Iran (85.4%, a difference of 0.020%), Immigrants from Eastern Europe (85.4%, a difference of 0.050%), Kenyan (85.4%, a difference of 0.060%), and Senegalese (85.4%, a difference of 0.070%).
| Demographics | Rating | Rank | In Labor Force | Age 30-34 |
| Cape Verdeans | 99.7 /100 | #51 | Exceptional 85.6% |
| Slovenes | 99.7 /100 | #52 | Exceptional 85.6% |
| Filipinos | 99.6 /100 | #53 | Exceptional 85.5% |
| Immigrants | Kenya | 99.6 /100 | #54 | Exceptional 85.5% |
| Immigrants | Turkey | 99.6 /100 | #55 | Exceptional 85.5% |
| Czechs | 99.6 /100 | #56 | Exceptional 85.5% |
| Russians | 99.6 /100 | #57 | Exceptional 85.5% |
| Poles | 99.6 /100 | #58 | Exceptional 85.5% |
| Immigrants | Poland | 99.5 /100 | #59 | Exceptional 85.5% |
| Immigrants | France | 99.5 /100 | #60 | Exceptional 85.5% |
| Immigrants | Brazil | 99.5 /100 | #61 | Exceptional 85.5% |
| Soviet Union | 99.4 /100 | #62 | Exceptional 85.5% |
| Macedonians | 99.4 /100 | #63 | Exceptional 85.5% |
| Italians | 99.4 /100 | #64 | Exceptional 85.4% |
| Senegalese | 99.4 /100 | #65 | Exceptional 85.4% |
| Ghanaians | 99.4 /100 | #66 | Exceptional 85.4% |
| Kenyans | 99.3 /100 | #67 | Exceptional 85.4% |
| Immigrants | Eastern Europe | 99.3 /100 | #68 | Exceptional 85.4% |
| Immigrants | Iran | 99.2 /100 | #69 | Exceptional 85.4% |
| Brazilians | 99.1 /100 | #70 | Exceptional 85.4% |
| Immigrants | Japan | 99.1 /100 | #71 | Exceptional 85.4% |