Immigrants from Cameroon vs Immigrants from Kazakhstan In Labor Force | Age 45-54
COMPARE
Immigrants from Cameroon
Immigrants from Kazakhstan
In Labor Force | Age 45-54
In Labor Force | Age 45-54 Comparison
Immigrants from Cameroon
Immigrants from Kazakhstan
84.6%
IN LABOR FORCE | AGE 45-54
100.0/ 100
METRIC RATING
7th/ 347
METRIC RANK
83.0%
IN LABOR FORCE | AGE 45-54
81.0/ 100
METRIC RATING
136th/ 347
METRIC RANK
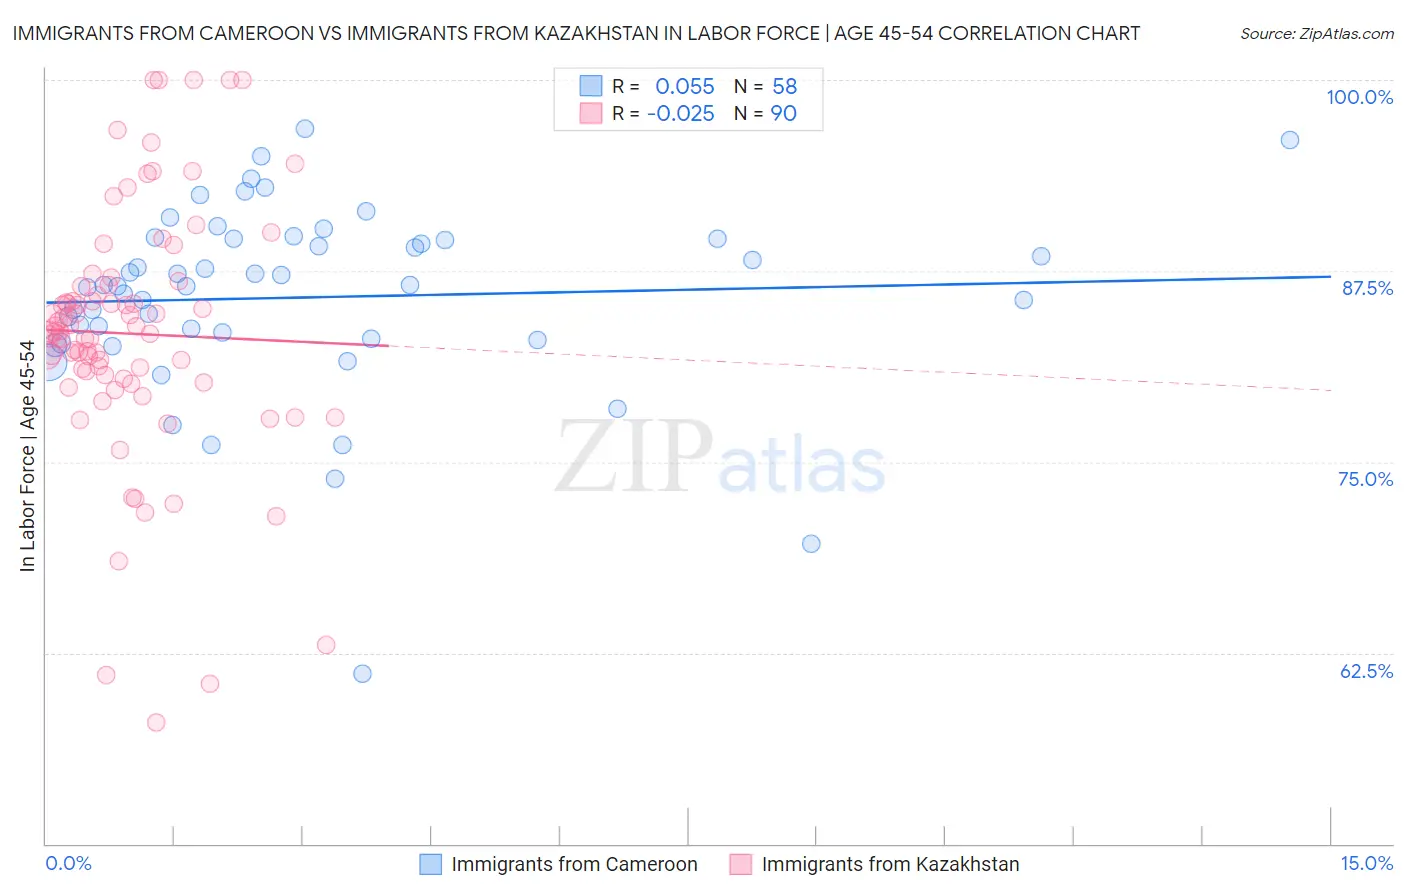
Immigrants from Cameroon vs Immigrants from Kazakhstan In Labor Force | Age 45-54 Correlation Chart
The statistical analysis conducted on geographies consisting of 130,722,370 people shows a slight positive correlation between the proportion of Immigrants from Cameroon and labor force participation rate among population between the ages 45 and 54 in the United States with a correlation coefficient (R) of 0.055 and weighted average of 84.6%. Similarly, the statistical analysis conducted on geographies consisting of 124,421,453 people shows no correlation between the proportion of Immigrants from Kazakhstan and labor force participation rate among population between the ages 45 and 54 in the United States with a correlation coefficient (R) of -0.025 and weighted average of 83.0%, a difference of 1.9%.
In Labor Force | Age 45-54 Correlation Summary
| Measurement | Immigrants from Cameroon | Immigrants from Kazakhstan |
| Minimum | 61.1% | 57.9% |
| Maximum | 96.8% | 100.0% |
| Range | 35.7% | 42.1% |
| Mean | 85.8% | 83.4% |
| Median | 86.5% | 83.5% |
| Interquartile 25% (IQ1) | 83.1% | 80.4% |
| Interquartile 75% (IQ3) | 89.6% | 86.5% |
| Interquartile Range (IQR) | 6.5% | 6.0% |
| Standard Deviation (Sample) | 6.2% | 8.2% |
| Standard Deviation (Population) | 6.2% | 8.1% |
Similar Demographics by In Labor Force | Age 45-54
Demographics Similar to Immigrants from Cameroon by In Labor Force | Age 45-54
In terms of in labor force | age 45-54, the demographic groups most similar to Immigrants from Cameroon are Immigrants from India (84.7%, a difference of 0.070%), Sierra Leonean (84.5%, a difference of 0.11%), Ethiopian (84.8%, a difference of 0.18%), Immigrants from Sierra Leone (84.4%, a difference of 0.22%), and Norwegian (84.4%, a difference of 0.24%).
| Demographics | Rating | Rank | In Labor Force | Age 45-54 |
| Immigrants | Bolivia | 100.0 /100 | #1 | Exceptional 85.3% |
| Luxembourgers | 100.0 /100 | #2 | Exceptional 85.0% |
| Bolivians | 100.0 /100 | #3 | Exceptional 84.9% |
| Immigrants | Ethiopia | 100.0 /100 | #4 | Exceptional 84.8% |
| Ethiopians | 100.0 /100 | #5 | Exceptional 84.8% |
| Immigrants | India | 100.0 /100 | #6 | Exceptional 84.7% |
| Immigrants | Cameroon | 100.0 /100 | #7 | Exceptional 84.6% |
| Sierra Leoneans | 100.0 /100 | #8 | Exceptional 84.5% |
| Immigrants | Sierra Leone | 100.0 /100 | #9 | Exceptional 84.4% |
| Norwegians | 100.0 /100 | #10 | Exceptional 84.4% |
| Thais | 100.0 /100 | #11 | Exceptional 84.3% |
| Bulgarians | 100.0 /100 | #12 | Exceptional 84.2% |
| Chinese | 99.9 /100 | #13 | Exceptional 84.1% |
| Cambodians | 99.9 /100 | #14 | Exceptional 84.1% |
| Cypriots | 99.9 /100 | #15 | Exceptional 84.1% |
Demographics Similar to Immigrants from Kazakhstan by In Labor Force | Age 45-54
In terms of in labor force | age 45-54, the demographic groups most similar to Immigrants from Kazakhstan are Austrian (83.0%, a difference of 0.0%), Sudanese (83.0%, a difference of 0.010%), Immigrants from Spain (83.0%, a difference of 0.010%), Ghanaian (83.0%, a difference of 0.020%), and Finnish (83.1%, a difference of 0.030%).
| Demographics | Rating | Rank | In Labor Force | Age 45-54 |
| Immigrants | Northern Europe | 85.1 /100 | #129 | Excellent 83.1% |
| Immigrants | Israel | 84.7 /100 | #130 | Excellent 83.1% |
| Finns | 83.3 /100 | #131 | Excellent 83.1% |
| Immigrants | Ukraine | 82.9 /100 | #132 | Excellent 83.0% |
| Liberians | 82.7 /100 | #133 | Excellent 83.0% |
| Sudanese | 82.0 /100 | #134 | Excellent 83.0% |
| Austrians | 81.3 /100 | #135 | Excellent 83.0% |
| Immigrants | Kazakhstan | 81.0 /100 | #136 | Excellent 83.0% |
| Immigrants | Spain | 80.4 /100 | #137 | Excellent 83.0% |
| Ghanaians | 79.5 /100 | #138 | Good 83.0% |
| Scandinavians | 78.5 /100 | #139 | Good 83.0% |
| Yugoslavians | 78.3 /100 | #140 | Good 83.0% |
| Immigrants | Haiti | 77.9 /100 | #141 | Good 83.0% |
| Immigrants | Scotland | 77.8 /100 | #142 | Good 83.0% |
| Okinawans | 77.0 /100 | #143 | Good 83.0% |