Slovak vs Mexican American Indian In Labor Force | Age 25-29
COMPARE
Slovak
Mexican American Indian
In Labor Force | Age 25-29
In Labor Force | Age 25-29 Comparison
Slovaks
Mexican American Indians
85.8%
IN LABOR FORCE | AGE 25-29
100.0/ 100
METRIC RATING
32nd/ 347
METRIC RANK
83.0%
IN LABOR FORCE | AGE 25-29
0.0/ 100
METRIC RATING
286th/ 347
METRIC RANK
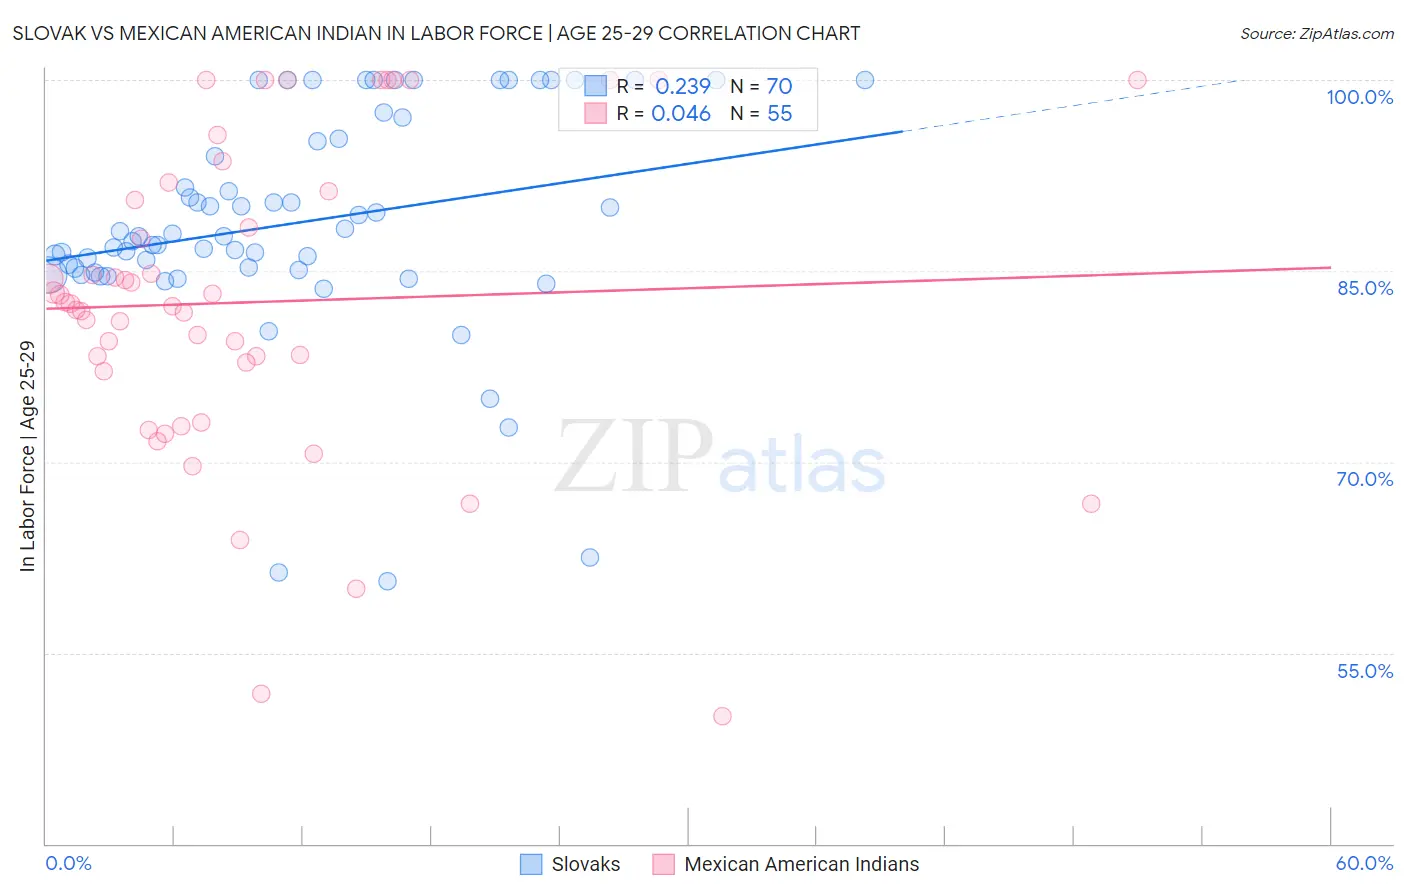
Slovak vs Mexican American Indian In Labor Force | Age 25-29 Correlation Chart
The statistical analysis conducted on geographies consisting of 397,677,043 people shows a weak positive correlation between the proportion of Slovaks and labor force participation rate among population between the ages 25 and 29 in the United States with a correlation coefficient (R) of 0.239 and weighted average of 85.8%. Similarly, the statistical analysis conducted on geographies consisting of 317,545,918 people shows no correlation between the proportion of Mexican American Indians and labor force participation rate among population between the ages 25 and 29 in the United States with a correlation coefficient (R) of 0.046 and weighted average of 83.0%, a difference of 3.4%.
In Labor Force | Age 25-29 Correlation Summary
| Measurement | Slovak | Mexican American Indian |
| Minimum | 60.6% | 50.0% |
| Maximum | 100.0% | 100.0% |
| Range | 39.4% | 50.0% |
| Mean | 88.8% | 82.6% |
| Median | 87.7% | 82.4% |
| Interquartile 25% (IQ1) | 85.1% | 77.2% |
| Interquartile 75% (IQ3) | 95.4% | 91.3% |
| Interquartile Range (IQR) | 10.3% | 14.1% |
| Standard Deviation (Sample) | 8.8% | 12.2% |
| Standard Deviation (Population) | 8.7% | 12.0% |
Similar Demographics by In Labor Force | Age 25-29
Demographics Similar to Slovaks by In Labor Force | Age 25-29
In terms of in labor force | age 25-29, the demographic groups most similar to Slovaks are German Russian (85.8%, a difference of 0.0%), Immigrants from Bulgaria (85.8%, a difference of 0.0%), Immigrants from Serbia (85.9%, a difference of 0.010%), Lithuanian (85.8%, a difference of 0.030%), and Cypriot (85.8%, a difference of 0.040%).
| Demographics | Rating | Rank | In Labor Force | Age 25-29 |
| Sudanese | 100.0 /100 | #25 | Exceptional 85.9% |
| Immigrants | North Macedonia | 100.0 /100 | #26 | Exceptional 85.9% |
| Paraguayans | 100.0 /100 | #27 | Exceptional 85.9% |
| Ugandans | 100.0 /100 | #28 | Exceptional 85.9% |
| Immigrants | Liberia | 100.0 /100 | #29 | Exceptional 85.9% |
| Immigrants | Serbia | 100.0 /100 | #30 | Exceptional 85.9% |
| German Russians | 100.0 /100 | #31 | Exceptional 85.8% |
| Slovaks | 100.0 /100 | #32 | Exceptional 85.8% |
| Immigrants | Bulgaria | 100.0 /100 | #33 | Exceptional 85.8% |
| Lithuanians | 99.9 /100 | #34 | Exceptional 85.8% |
| Cypriots | 99.9 /100 | #35 | Exceptional 85.8% |
| Immigrants | Nepal | 99.9 /100 | #36 | Exceptional 85.8% |
| Poles | 99.9 /100 | #37 | Exceptional 85.8% |
| Sierra Leoneans | 99.9 /100 | #38 | Exceptional 85.8% |
| Croatians | 99.9 /100 | #39 | Exceptional 85.8% |
Demographics Similar to Mexican American Indians by In Labor Force | Age 25-29
In terms of in labor force | age 25-29, the demographic groups most similar to Mexican American Indians are Belizean (83.1%, a difference of 0.020%), Guyanese (83.0%, a difference of 0.020%), Ottawa (83.0%, a difference of 0.040%), Nicaraguan (83.1%, a difference of 0.050%), and Immigrants from Micronesia (83.0%, a difference of 0.060%).
| Demographics | Rating | Rank | In Labor Force | Age 25-29 |
| British West Indians | 0.0 /100 | #279 | Tragic 83.2% |
| Dominicans | 0.0 /100 | #280 | Tragic 83.2% |
| Immigrants | Dominican Republic | 0.0 /100 | #281 | Tragic 83.1% |
| Americans | 0.0 /100 | #282 | Tragic 83.1% |
| Immigrants | Azores | 0.0 /100 | #283 | Tragic 83.1% |
| Nicaraguans | 0.0 /100 | #284 | Tragic 83.1% |
| Belizeans | 0.0 /100 | #285 | Tragic 83.1% |
| Mexican American Indians | 0.0 /100 | #286 | Tragic 83.0% |
| Guyanese | 0.0 /100 | #287 | Tragic 83.0% |
| Ottawa | 0.0 /100 | #288 | Tragic 83.0% |
| Immigrants | Micronesia | 0.0 /100 | #289 | Tragic 83.0% |
| Immigrants | Bangladesh | 0.0 /100 | #290 | Tragic 83.0% |
| Hawaiians | 0.0 /100 | #291 | Tragic 83.0% |
| Immigrants | Guyana | 0.0 /100 | #292 | Tragic 83.0% |
| Immigrants | Latin America | 0.0 /100 | #293 | Tragic 82.9% |