Immigrants from Northern Africa vs Mexican American Indian In Labor Force | Age 25-29
COMPARE
Immigrants from Northern Africa
Mexican American Indian
In Labor Force | Age 25-29
In Labor Force | Age 25-29 Comparison
Immigrants from Northern Africa
Mexican American Indians
85.2%
IN LABOR FORCE | AGE 25-29
97.6/ 100
METRIC RATING
79th/ 347
METRIC RANK
83.0%
IN LABOR FORCE | AGE 25-29
0.0/ 100
METRIC RATING
286th/ 347
METRIC RANK
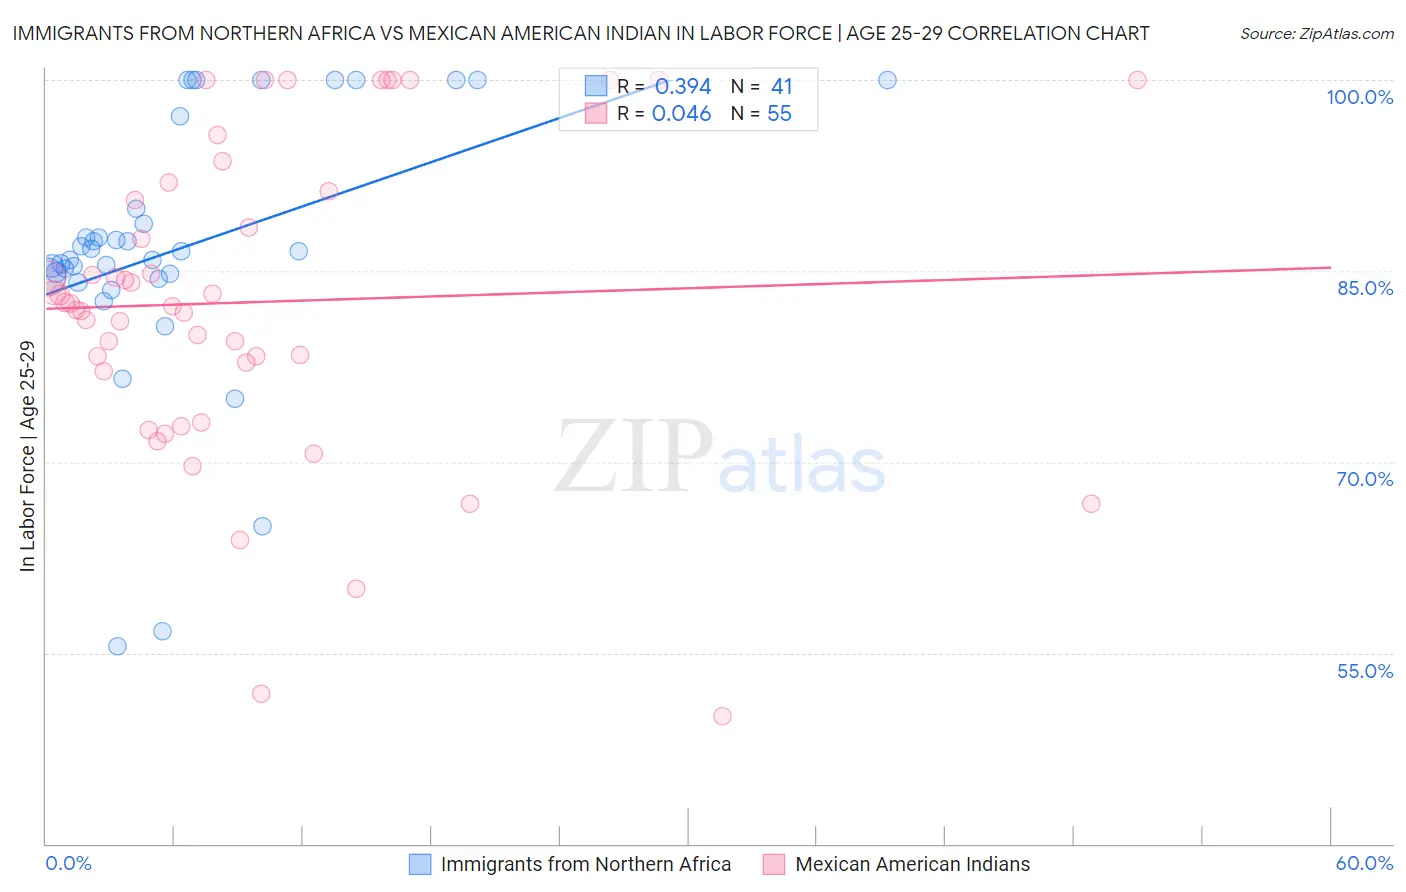
Immigrants from Northern Africa vs Mexican American Indian In Labor Force | Age 25-29 Correlation Chart
The statistical analysis conducted on geographies consisting of 321,133,996 people shows a mild positive correlation between the proportion of Immigrants from Northern Africa and labor force participation rate among population between the ages 25 and 29 in the United States with a correlation coefficient (R) of 0.394 and weighted average of 85.2%. Similarly, the statistical analysis conducted on geographies consisting of 317,545,918 people shows no correlation between the proportion of Mexican American Indians and labor force participation rate among population between the ages 25 and 29 in the United States with a correlation coefficient (R) of 0.046 and weighted average of 83.0%, a difference of 2.6%.
In Labor Force | Age 25-29 Correlation Summary
| Measurement | Immigrants from Northern Africa | Mexican American Indian |
| Minimum | 55.5% | 50.0% |
| Maximum | 100.0% | 100.0% |
| Range | 44.5% | 50.0% |
| Mean | 86.7% | 82.6% |
| Median | 86.5% | 82.4% |
| Interquartile 25% (IQ1) | 84.5% | 77.2% |
| Interquartile 75% (IQ3) | 93.5% | 91.3% |
| Interquartile Range (IQR) | 9.1% | 14.1% |
| Standard Deviation (Sample) | 10.5% | 12.2% |
| Standard Deviation (Population) | 10.4% | 12.0% |
Similar Demographics by In Labor Force | Age 25-29
Demographics Similar to Immigrants from Northern Africa by In Labor Force | Age 25-29
In terms of in labor force | age 25-29, the demographic groups most similar to Immigrants from Northern Africa are Immigrants from Zimbabwe (85.2%, a difference of 0.0%), Immigrants from Egypt (85.2%, a difference of 0.010%), Immigrants from South Central Asia (85.2%, a difference of 0.020%), Immigrants from Northern Europe (85.2%, a difference of 0.030%), and German (85.3%, a difference of 0.040%).
| Demographics | Rating | Rank | In Labor Force | Age 25-29 |
| Immigrants | Australia | 98.9 /100 | #72 | Exceptional 85.3% |
| Russians | 98.8 /100 | #73 | Exceptional 85.3% |
| Soviet Union | 98.5 /100 | #74 | Exceptional 85.3% |
| Brazilians | 98.3 /100 | #75 | Exceptional 85.3% |
| Germans | 98.1 /100 | #76 | Exceptional 85.3% |
| Immigrants | South Central Asia | 97.9 /100 | #77 | Exceptional 85.2% |
| Immigrants | Egypt | 97.7 /100 | #78 | Exceptional 85.2% |
| Immigrants | Northern Africa | 97.6 /100 | #79 | Exceptional 85.2% |
| Immigrants | Zimbabwe | 97.6 /100 | #80 | Exceptional 85.2% |
| Immigrants | Northern Europe | 97.2 /100 | #81 | Exceptional 85.2% |
| Okinawans | 97.0 /100 | #82 | Exceptional 85.2% |
| Immigrants | Europe | 96.8 /100 | #83 | Exceptional 85.2% |
| Immigrants | Eastern Europe | 96.8 /100 | #84 | Exceptional 85.2% |
| Immigrants | Africa | 96.7 /100 | #85 | Exceptional 85.2% |
| Ukrainians | 96.7 /100 | #86 | Exceptional 85.2% |
Demographics Similar to Mexican American Indians by In Labor Force | Age 25-29
In terms of in labor force | age 25-29, the demographic groups most similar to Mexican American Indians are Belizean (83.1%, a difference of 0.020%), Guyanese (83.0%, a difference of 0.020%), Ottawa (83.0%, a difference of 0.040%), Nicaraguan (83.1%, a difference of 0.050%), and Immigrants from Micronesia (83.0%, a difference of 0.060%).
| Demographics | Rating | Rank | In Labor Force | Age 25-29 |
| British West Indians | 0.0 /100 | #279 | Tragic 83.2% |
| Dominicans | 0.0 /100 | #280 | Tragic 83.2% |
| Immigrants | Dominican Republic | 0.0 /100 | #281 | Tragic 83.1% |
| Americans | 0.0 /100 | #282 | Tragic 83.1% |
| Immigrants | Azores | 0.0 /100 | #283 | Tragic 83.1% |
| Nicaraguans | 0.0 /100 | #284 | Tragic 83.1% |
| Belizeans | 0.0 /100 | #285 | Tragic 83.1% |
| Mexican American Indians | 0.0 /100 | #286 | Tragic 83.0% |
| Guyanese | 0.0 /100 | #287 | Tragic 83.0% |
| Ottawa | 0.0 /100 | #288 | Tragic 83.0% |
| Immigrants | Micronesia | 0.0 /100 | #289 | Tragic 83.0% |
| Immigrants | Bangladesh | 0.0 /100 | #290 | Tragic 83.0% |
| Hawaiians | 0.0 /100 | #291 | Tragic 83.0% |
| Immigrants | Guyana | 0.0 /100 | #292 | Tragic 83.0% |
| Immigrants | Latin America | 0.0 /100 | #293 | Tragic 82.9% |