Slovak vs Kenyan In Labor Force | Age 25-29
COMPARE
Slovak
Kenyan
In Labor Force | Age 25-29
In Labor Force | Age 25-29 Comparison
Slovaks
Kenyans
85.8%
IN LABOR FORCE | AGE 25-29
100.0/ 100
METRIC RATING
32nd/ 347
METRIC RANK
85.4%
IN LABOR FORCE | AGE 25-29
99.0/ 100
METRIC RATING
71st/ 347
METRIC RANK
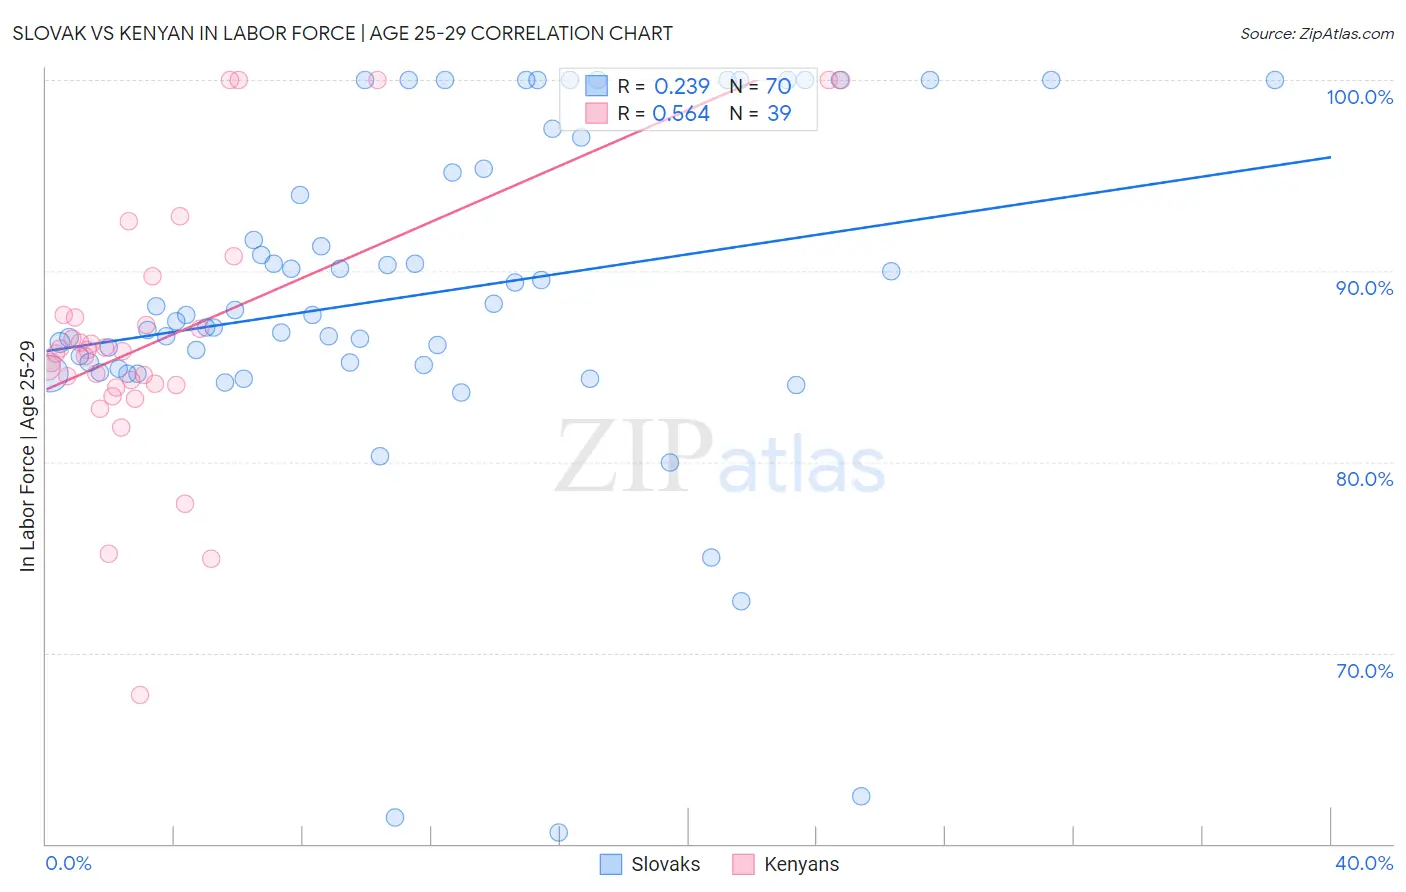
Slovak vs Kenyan In Labor Force | Age 25-29 Correlation Chart
The statistical analysis conducted on geographies consisting of 397,677,043 people shows a weak positive correlation between the proportion of Slovaks and labor force participation rate among population between the ages 25 and 29 in the United States with a correlation coefficient (R) of 0.239 and weighted average of 85.8%. Similarly, the statistical analysis conducted on geographies consisting of 168,218,619 people shows a substantial positive correlation between the proportion of Kenyans and labor force participation rate among population between the ages 25 and 29 in the United States with a correlation coefficient (R) of 0.564 and weighted average of 85.4%, a difference of 0.55%.
In Labor Force | Age 25-29 Correlation Summary
| Measurement | Slovak | Kenyan |
| Minimum | 60.6% | 67.8% |
| Maximum | 100.0% | 100.0% |
| Range | 39.4% | 32.2% |
| Mean | 88.8% | 86.6% |
| Median | 87.7% | 85.8% |
| Interquartile 25% (IQ1) | 85.1% | 84.1% |
| Interquartile 75% (IQ3) | 95.4% | 87.7% |
| Interquartile Range (IQR) | 10.3% | 3.6% |
| Standard Deviation (Sample) | 8.8% | 6.9% |
| Standard Deviation (Population) | 8.7% | 6.8% |
Similar Demographics by In Labor Force | Age 25-29
Demographics Similar to Slovaks by In Labor Force | Age 25-29
In terms of in labor force | age 25-29, the demographic groups most similar to Slovaks are German Russian (85.8%, a difference of 0.0%), Immigrants from Bulgaria (85.8%, a difference of 0.0%), Immigrants from Serbia (85.9%, a difference of 0.010%), Lithuanian (85.8%, a difference of 0.030%), and Cypriot (85.8%, a difference of 0.040%).
| Demographics | Rating | Rank | In Labor Force | Age 25-29 |
| Sudanese | 100.0 /100 | #25 | Exceptional 85.9% |
| Immigrants | North Macedonia | 100.0 /100 | #26 | Exceptional 85.9% |
| Paraguayans | 100.0 /100 | #27 | Exceptional 85.9% |
| Ugandans | 100.0 /100 | #28 | Exceptional 85.9% |
| Immigrants | Liberia | 100.0 /100 | #29 | Exceptional 85.9% |
| Immigrants | Serbia | 100.0 /100 | #30 | Exceptional 85.9% |
| German Russians | 100.0 /100 | #31 | Exceptional 85.8% |
| Slovaks | 100.0 /100 | #32 | Exceptional 85.8% |
| Immigrants | Bulgaria | 100.0 /100 | #33 | Exceptional 85.8% |
| Lithuanians | 99.9 /100 | #34 | Exceptional 85.8% |
| Cypriots | 99.9 /100 | #35 | Exceptional 85.8% |
| Immigrants | Nepal | 99.9 /100 | #36 | Exceptional 85.8% |
| Poles | 99.9 /100 | #37 | Exceptional 85.8% |
| Sierra Leoneans | 99.9 /100 | #38 | Exceptional 85.8% |
| Croatians | 99.9 /100 | #39 | Exceptional 85.8% |
Demographics Similar to Kenyans by In Labor Force | Age 25-29
In terms of in labor force | age 25-29, the demographic groups most similar to Kenyans are Menominee (85.4%, a difference of 0.020%), Immigrants from Sweden (85.4%, a difference of 0.020%), Immigrants from Australia (85.3%, a difference of 0.020%), Russian (85.3%, a difference of 0.030%), and Immigrants from Turkey (85.4%, a difference of 0.040%).
| Demographics | Rating | Rank | In Labor Force | Age 25-29 |
| Immigrants | Italy | 99.3 /100 | #64 | Exceptional 85.4% |
| Immigrants | Czechoslovakia | 99.3 /100 | #65 | Exceptional 85.4% |
| Immigrants | Scotland | 99.3 /100 | #66 | Exceptional 85.4% |
| Immigrants | Turkey | 99.2 /100 | #67 | Exceptional 85.4% |
| Immigrants | Cameroon | 99.2 /100 | #68 | Exceptional 85.4% |
| Menominee | 99.1 /100 | #69 | Exceptional 85.4% |
| Immigrants | Sweden | 99.1 /100 | #70 | Exceptional 85.4% |
| Kenyans | 99.0 /100 | #71 | Exceptional 85.4% |
| Immigrants | Australia | 98.9 /100 | #72 | Exceptional 85.3% |
| Russians | 98.8 /100 | #73 | Exceptional 85.3% |
| Soviet Union | 98.5 /100 | #74 | Exceptional 85.3% |
| Brazilians | 98.3 /100 | #75 | Exceptional 85.3% |
| Germans | 98.1 /100 | #76 | Exceptional 85.3% |
| Immigrants | South Central Asia | 97.9 /100 | #77 | Exceptional 85.2% |
| Immigrants | Egypt | 97.7 /100 | #78 | Exceptional 85.2% |