Sierra Leonean vs Japanese In Labor Force | Age 35-44
COMPARE
Sierra Leonean
Japanese
In Labor Force | Age 35-44
In Labor Force | Age 35-44 Comparison
Sierra Leoneans
Japanese
86.4%
IN LABOR FORCE | AGE 35-44
100.0/ 100
METRIC RATING
1st/ 347
METRIC RANK
83.6%
IN LABOR FORCE | AGE 35-44
0.3/ 100
METRIC RATING
256th/ 347
METRIC RANK
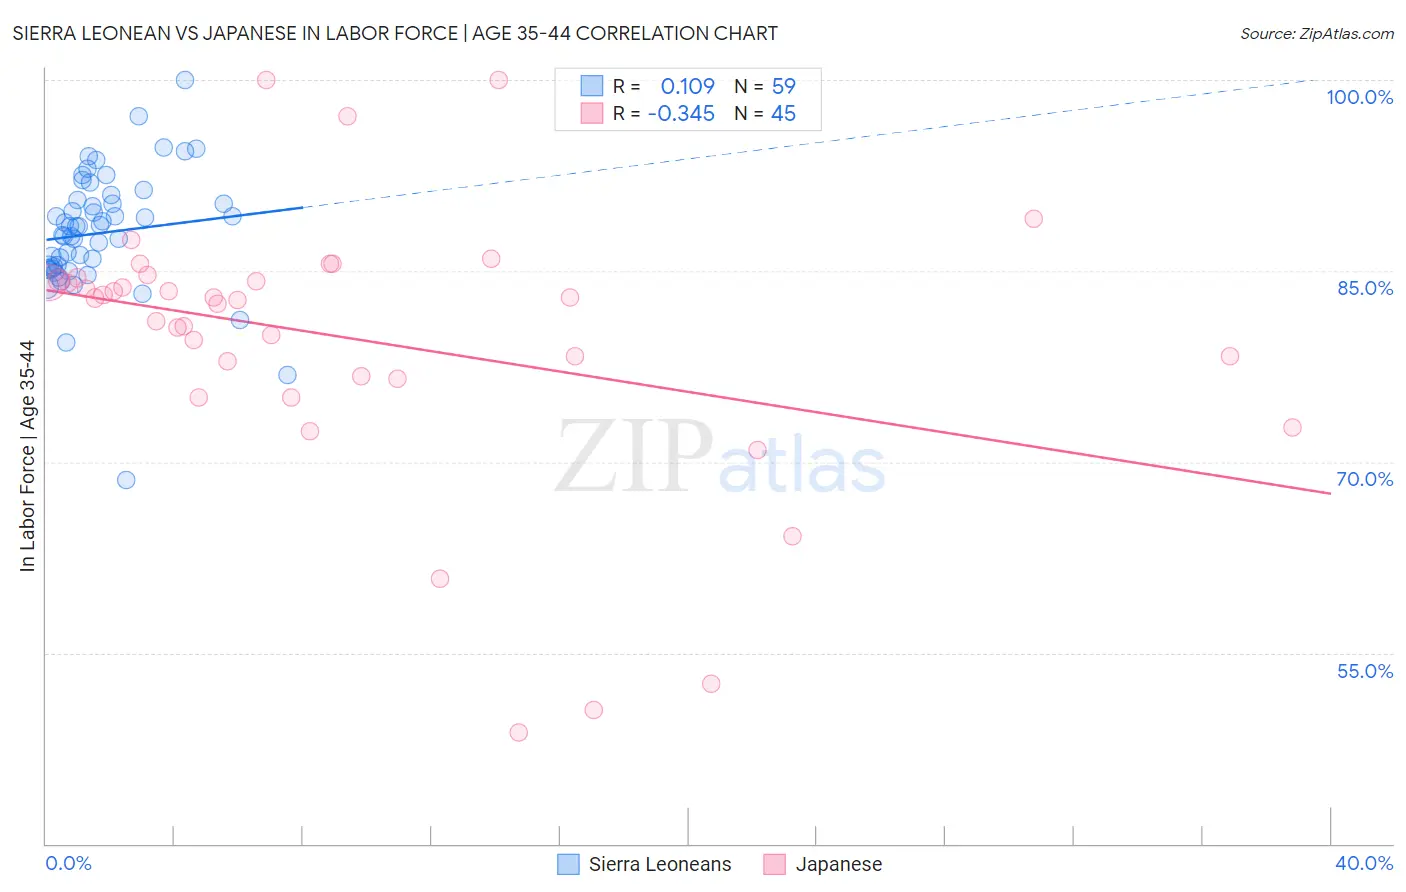
Sierra Leonean vs Japanese In Labor Force | Age 35-44 Correlation Chart
The statistical analysis conducted on geographies consisting of 83,346,691 people shows a poor positive correlation between the proportion of Sierra Leoneans and labor force participation rate among population between the ages 35 and 44 in the United States with a correlation coefficient (R) of 0.109 and weighted average of 86.4%. Similarly, the statistical analysis conducted on geographies consisting of 249,106,093 people shows a mild negative correlation between the proportion of Japanese and labor force participation rate among population between the ages 35 and 44 in the United States with a correlation coefficient (R) of -0.345 and weighted average of 83.6%, a difference of 3.4%.
In Labor Force | Age 35-44 Correlation Summary
| Measurement | Sierra Leonean | Japanese |
| Minimum | 68.6% | 48.7% |
| Maximum | 100.0% | 100.0% |
| Range | 31.4% | 51.3% |
| Mean | 88.0% | 79.7% |
| Median | 88.5% | 82.9% |
| Interquartile 25% (IQ1) | 85.1% | 76.6% |
| Interquartile 75% (IQ3) | 90.5% | 84.4% |
| Interquartile Range (IQR) | 5.4% | 7.8% |
| Standard Deviation (Sample) | 4.9% | 10.7% |
| Standard Deviation (Population) | 4.8% | 10.6% |
Similar Demographics by In Labor Force | Age 35-44
Demographics Similar to Sierra Leoneans by In Labor Force | Age 35-44
In terms of in labor force | age 35-44, the demographic groups most similar to Sierra Leoneans are Luxembourger (86.4%, a difference of 0.030%), Immigrants from Bolivia (86.2%, a difference of 0.21%), Immigrants from Cabo Verde (86.2%, a difference of 0.24%), Zimbabwean (86.1%, a difference of 0.37%), and Bolivian (86.1%, a difference of 0.38%).
| Demographics | Rating | Rank | In Labor Force | Age 35-44 |
| Sierra Leoneans | 100.0 /100 | #1 | Exceptional 86.4% |
| Luxembourgers | 100.0 /100 | #2 | Exceptional 86.4% |
| Immigrants | Bolivia | 100.0 /100 | #3 | Exceptional 86.2% |
| Immigrants | Cabo Verde | 100.0 /100 | #4 | Exceptional 86.2% |
| Zimbabweans | 100.0 /100 | #5 | Exceptional 86.1% |
| Bolivians | 100.0 /100 | #6 | Exceptional 86.1% |
| Immigrants | Sierra Leone | 100.0 /100 | #7 | Exceptional 86.1% |
| Immigrants | Ethiopia | 100.0 /100 | #8 | Exceptional 85.9% |
| Ethiopians | 100.0 /100 | #9 | Exceptional 85.9% |
| Cape Verdeans | 100.0 /100 | #10 | Exceptional 85.8% |
| Immigrants | Cameroon | 100.0 /100 | #11 | Exceptional 85.8% |
| Liberians | 100.0 /100 | #12 | Exceptional 85.7% |
| Somalis | 100.0 /100 | #13 | Exceptional 85.6% |
| Immigrants | Somalia | 100.0 /100 | #14 | Exceptional 85.6% |
| Norwegians | 100.0 /100 | #15 | Exceptional 85.6% |
Demographics Similar to Japanese by In Labor Force | Age 35-44
In terms of in labor force | age 35-44, the demographic groups most similar to Japanese are Immigrants from the Azores (83.6%, a difference of 0.020%), Basque (83.6%, a difference of 0.020%), Tongan (83.6%, a difference of 0.040%), Tsimshian (83.5%, a difference of 0.040%), and Salvadoran (83.6%, a difference of 0.060%).
| Demographics | Rating | Rank | In Labor Force | Age 35-44 |
| Immigrants | St. Vincent and the Grenadines | 0.7 /100 | #249 | Tragic 83.7% |
| Whites/Caucasians | 0.5 /100 | #250 | Tragic 83.6% |
| Salvadorans | 0.4 /100 | #251 | Tragic 83.6% |
| Immigrants | Guyana | 0.4 /100 | #252 | Tragic 83.6% |
| Lebanese | 0.4 /100 | #253 | Tragic 83.6% |
| Tongans | 0.4 /100 | #254 | Tragic 83.6% |
| Immigrants | Azores | 0.3 /100 | #255 | Tragic 83.6% |
| Japanese | 0.3 /100 | #256 | Tragic 83.6% |
| Basques | 0.3 /100 | #257 | Tragic 83.6% |
| Tsimshian | 0.2 /100 | #258 | Tragic 83.5% |
| Immigrants | El Salvador | 0.2 /100 | #259 | Tragic 83.5% |
| Vietnamese | 0.2 /100 | #260 | Tragic 83.5% |
| Immigrants | Dominica | 0.2 /100 | #261 | Tragic 83.5% |
| Immigrants | Congo | 0.2 /100 | #262 | Tragic 83.5% |
| Iroquois | 0.2 /100 | #263 | Tragic 83.5% |