Nigerian vs Dutch In Labor Force | Age 30-34
COMPARE
Nigerian
Dutch
In Labor Force | Age 30-34
In Labor Force | Age 30-34 Comparison
Nigerians
Dutch
84.5%
IN LABOR FORCE | AGE 30-34
28.9/ 100
METRIC RATING
189th/ 347
METRIC RANK
84.5%
IN LABOR FORCE | AGE 30-34
20.2/ 100
METRIC RATING
198th/ 347
METRIC RANK
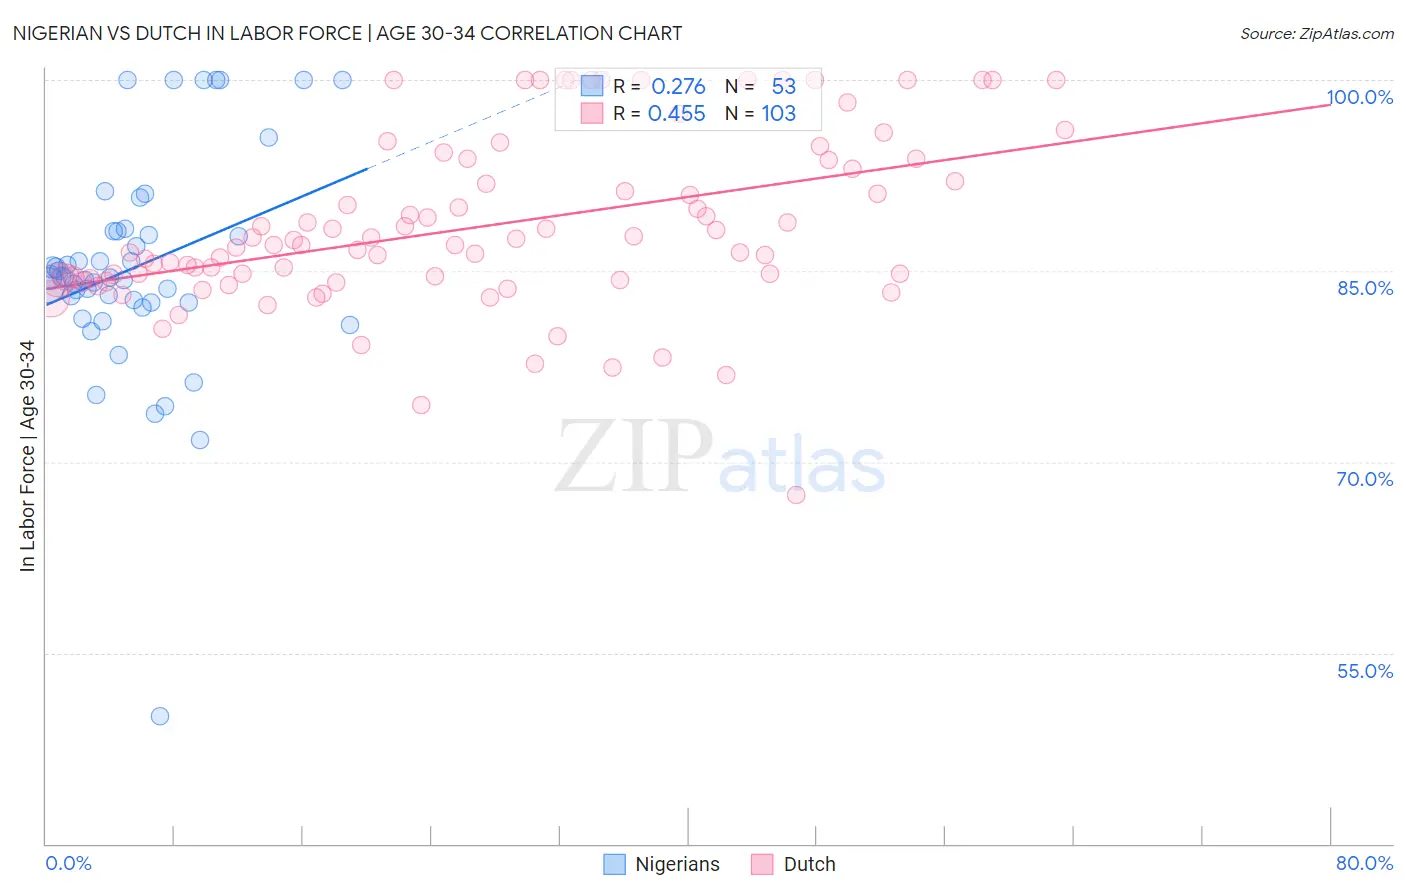
Nigerian vs Dutch In Labor Force | Age 30-34 Correlation Chart
The statistical analysis conducted on geographies consisting of 332,575,252 people shows a weak positive correlation between the proportion of Nigerians and labor force participation rate among population between the ages 30 and 34 in the United States with a correlation coefficient (R) of 0.276 and weighted average of 84.5%. Similarly, the statistical analysis conducted on geographies consisting of 553,365,040 people shows a moderate positive correlation between the proportion of Dutch and labor force participation rate among population between the ages 30 and 34 in the United States with a correlation coefficient (R) of 0.455 and weighted average of 84.5%, a difference of 0.080%.
In Labor Force | Age 30-34 Correlation Summary
| Measurement | Nigerian | Dutch |
| Minimum | 50.0% | 67.4% |
| Maximum | 100.0% | 100.0% |
| Range | 50.0% | 32.6% |
| Mean | 85.3% | 88.5% |
| Median | 84.5% | 87.0% |
| Interquartile 25% (IQ1) | 82.5% | 84.3% |
| Interquartile 75% (IQ3) | 88.1% | 93.7% |
| Interquartile Range (IQR) | 5.6% | 9.4% |
| Standard Deviation (Sample) | 8.6% | 6.7% |
| Standard Deviation (Population) | 8.5% | 6.7% |
Demographics Similar to Nigerians and Dutch by In Labor Force | Age 30-34
In terms of in labor force | age 30-34, the demographic groups most similar to Nigerians are Taiwanese (84.6%, a difference of 0.0%), Immigrants from Congo (84.6%, a difference of 0.010%), Costa Rican (84.6%, a difference of 0.010%), Immigrants from Philippines (84.6%, a difference of 0.020%), and Immigrants from Zaire (84.5%, a difference of 0.030%). Similarly, the demographic groups most similar to Dutch are Immigrants from Thailand (84.5%, a difference of 0.010%), Subsaharan African (84.5%, a difference of 0.010%), Immigrants from Syria (84.5%, a difference of 0.020%), Trinidadian and Tobagonian (84.5%, a difference of 0.020%), and Immigrants from West Indies (84.5%, a difference of 0.020%).
| Demographics | Rating | Rank | In Labor Force | Age 30-34 |
| Immigrants | Canada | 35.0 /100 | #183 | Fair 84.6% |
| Immigrants | North America | 33.3 /100 | #184 | Fair 84.6% |
| Immigrants | Philippines | 31.5 /100 | #185 | Fair 84.6% |
| Immigrants | Congo | 29.7 /100 | #186 | Fair 84.6% |
| Costa Ricans | 29.6 /100 | #187 | Fair 84.6% |
| Taiwanese | 29.4 /100 | #188 | Fair 84.6% |
| Nigerians | 28.9 /100 | #189 | Fair 84.5% |
| Immigrants | Zaire | 25.8 /100 | #190 | Fair 84.5% |
| Hungarians | 24.8 /100 | #191 | Fair 84.5% |
| Scandinavians | 24.7 /100 | #192 | Fair 84.5% |
| Immigrants | Costa Rica | 23.9 /100 | #193 | Fair 84.5% |
| Immigrants | Afghanistan | 23.5 /100 | #194 | Fair 84.5% |
| Koreans | 23.2 /100 | #195 | Fair 84.5% |
| British | 22.9 /100 | #196 | Fair 84.5% |
| Immigrants | Syria | 21.9 /100 | #197 | Fair 84.5% |
| Dutch | 20.2 /100 | #198 | Fair 84.5% |
| Immigrants | Thailand | 19.1 /100 | #199 | Poor 84.5% |
| Sub-Saharan Africans | 19.0 /100 | #200 | Poor 84.5% |
| Trinidadians and Tobagonians | 18.2 /100 | #201 | Poor 84.5% |
| Immigrants | West Indies | 18.1 /100 | #202 | Poor 84.5% |
| Canadians | 15.4 /100 | #203 | Poor 84.4% |