Scottish vs Immigrants from Colombia In Labor Force | Age 16-19
COMPARE
Scottish
Immigrants from Colombia
In Labor Force | Age 16-19
In Labor Force | Age 16-19 Comparison
Scottish
Immigrants from Colombia
42.0%
IN LABOR FORCE | AGE 16-19
100.0/ 100
METRIC RATING
30th/ 347
METRIC RANK
33.5%
IN LABOR FORCE | AGE 16-19
0.1/ 100
METRIC RATING
290th/ 347
METRIC RANK
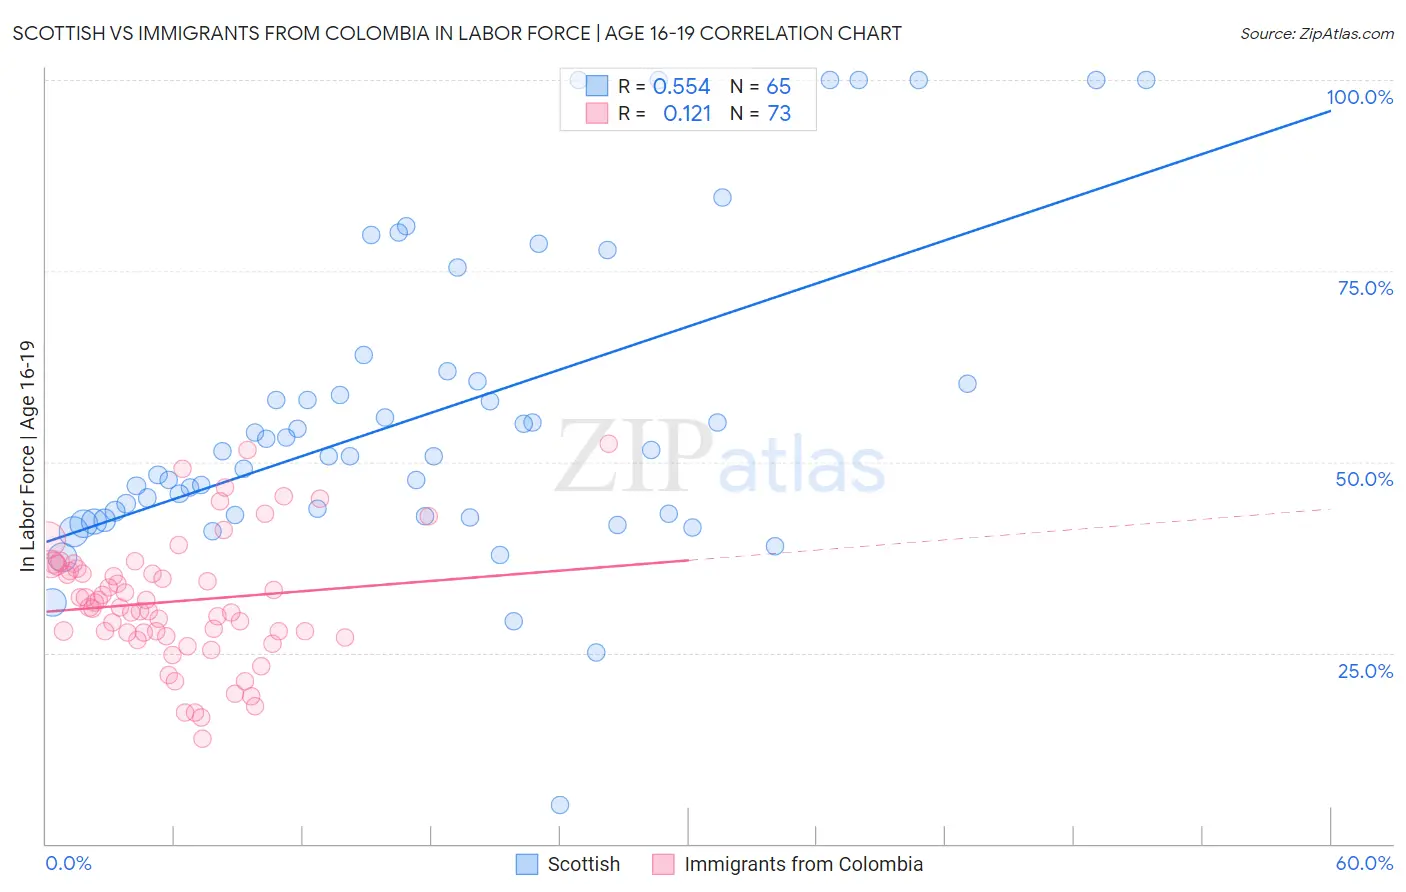
Scottish vs Immigrants from Colombia In Labor Force | Age 16-19 Correlation Chart
The statistical analysis conducted on geographies consisting of 562,983,292 people shows a substantial positive correlation between the proportion of Scottish and labor force participation rate among population between the ages 16 and 19 in the United States with a correlation coefficient (R) of 0.554 and weighted average of 42.0%. Similarly, the statistical analysis conducted on geographies consisting of 378,135,615 people shows a poor positive correlation between the proportion of Immigrants from Colombia and labor force participation rate among population between the ages 16 and 19 in the United States with a correlation coefficient (R) of 0.121 and weighted average of 33.5%, a difference of 25.5%.
In Labor Force | Age 16-19 Correlation Summary
| Measurement | Scottish | Immigrants from Colombia |
| Minimum | 5.0% | 13.7% |
| Maximum | 100.0% | 52.4% |
| Range | 95.0% | 38.7% |
| Mean | 56.2% | 31.7% |
| Median | 50.8% | 31.0% |
| Interquartile 25% (IQ1) | 42.9% | 27.4% |
| Interquartile 75% (IQ3) | 61.2% | 36.3% |
| Interquartile Range (IQR) | 18.3% | 8.9% |
| Standard Deviation (Sample) | 20.5% | 8.2% |
| Standard Deviation (Population) | 20.4% | 8.1% |
Similar Demographics by In Labor Force | Age 16-19
Demographics Similar to Scottish by In Labor Force | Age 16-19
In terms of in labor force | age 16-19, the demographic groups most similar to Scottish are Irish (42.0%, a difference of 0.070%), Czechoslovakian (41.9%, a difference of 0.27%), French (42.1%, a difference of 0.28%), Polish (42.1%, a difference of 0.33%), and Liberian (41.8%, a difference of 0.41%).
| Demographics | Rating | Rank | In Labor Force | Age 16-19 |
| Slovaks | 100.0 /100 | #23 | Exceptional 42.6% |
| Bangladeshis | 100.0 /100 | #24 | Exceptional 42.5% |
| German Russians | 100.0 /100 | #25 | Exceptional 42.4% |
| English | 100.0 /100 | #26 | Exceptional 42.4% |
| Welsh | 100.0 /100 | #27 | Exceptional 42.3% |
| Poles | 100.0 /100 | #28 | Exceptional 42.1% |
| French | 100.0 /100 | #29 | Exceptional 42.1% |
| Scottish | 100.0 /100 | #30 | Exceptional 42.0% |
| Irish | 100.0 /100 | #31 | Exceptional 42.0% |
| Czechoslovakians | 100.0 /100 | #32 | Exceptional 41.9% |
| Liberians | 100.0 /100 | #33 | Exceptional 41.8% |
| Immigrants | Bosnia and Herzegovina | 100.0 /100 | #34 | Exceptional 41.8% |
| Yugoslavians | 100.0 /100 | #35 | Exceptional 41.8% |
| Immigrants | Azores | 100.0 /100 | #36 | Exceptional 41.7% |
| Immigrants | Congo | 100.0 /100 | #37 | Exceptional 41.7% |
Demographics Similar to Immigrants from Colombia by In Labor Force | Age 16-19
In terms of in labor force | age 16-19, the demographic groups most similar to Immigrants from Colombia are Immigrants from Belarus (33.4%, a difference of 0.080%), Immigrants from Indonesia (33.5%, a difference of 0.14%), Immigrants from Singapore (33.5%, a difference of 0.14%), Haitian (33.4%, a difference of 0.14%), and Nepalese (33.5%, a difference of 0.18%).
| Demographics | Rating | Rank | In Labor Force | Age 16-19 |
| Immigrants | Venezuela | 0.2 /100 | #283 | Tragic 33.7% |
| Immigrants | Spain | 0.2 /100 | #284 | Tragic 33.7% |
| U.S. Virgin Islanders | 0.2 /100 | #285 | Tragic 33.6% |
| South Americans | 0.2 /100 | #286 | Tragic 33.6% |
| Nepalese | 0.1 /100 | #287 | Tragic 33.5% |
| Immigrants | Indonesia | 0.1 /100 | #288 | Tragic 33.5% |
| Immigrants | Singapore | 0.1 /100 | #289 | Tragic 33.5% |
| Immigrants | Colombia | 0.1 /100 | #290 | Tragic 33.5% |
| Immigrants | Belarus | 0.1 /100 | #291 | Tragic 33.4% |
| Haitians | 0.1 /100 | #292 | Tragic 33.4% |
| Immigrants | South America | 0.1 /100 | #293 | Tragic 33.3% |
| Argentineans | 0.1 /100 | #294 | Tragic 33.3% |
| Yup'ik | 0.1 /100 | #295 | Tragic 33.3% |
| Jamaicans | 0.1 /100 | #296 | Tragic 33.2% |
| Immigrants | Haiti | 0.1 /100 | #297 | Tragic 33.2% |