Immigrants from Poland vs Immigrants from Colombia In Labor Force | Age 16-19
COMPARE
Immigrants from Poland
Immigrants from Colombia
In Labor Force | Age 16-19
In Labor Force | Age 16-19 Comparison
Immigrants from Poland
Immigrants from Colombia
37.3%
IN LABOR FORCE | AGE 16-19
84.4/ 100
METRIC RATING
151st/ 347
METRIC RANK
33.5%
IN LABOR FORCE | AGE 16-19
0.1/ 100
METRIC RATING
290th/ 347
METRIC RANK
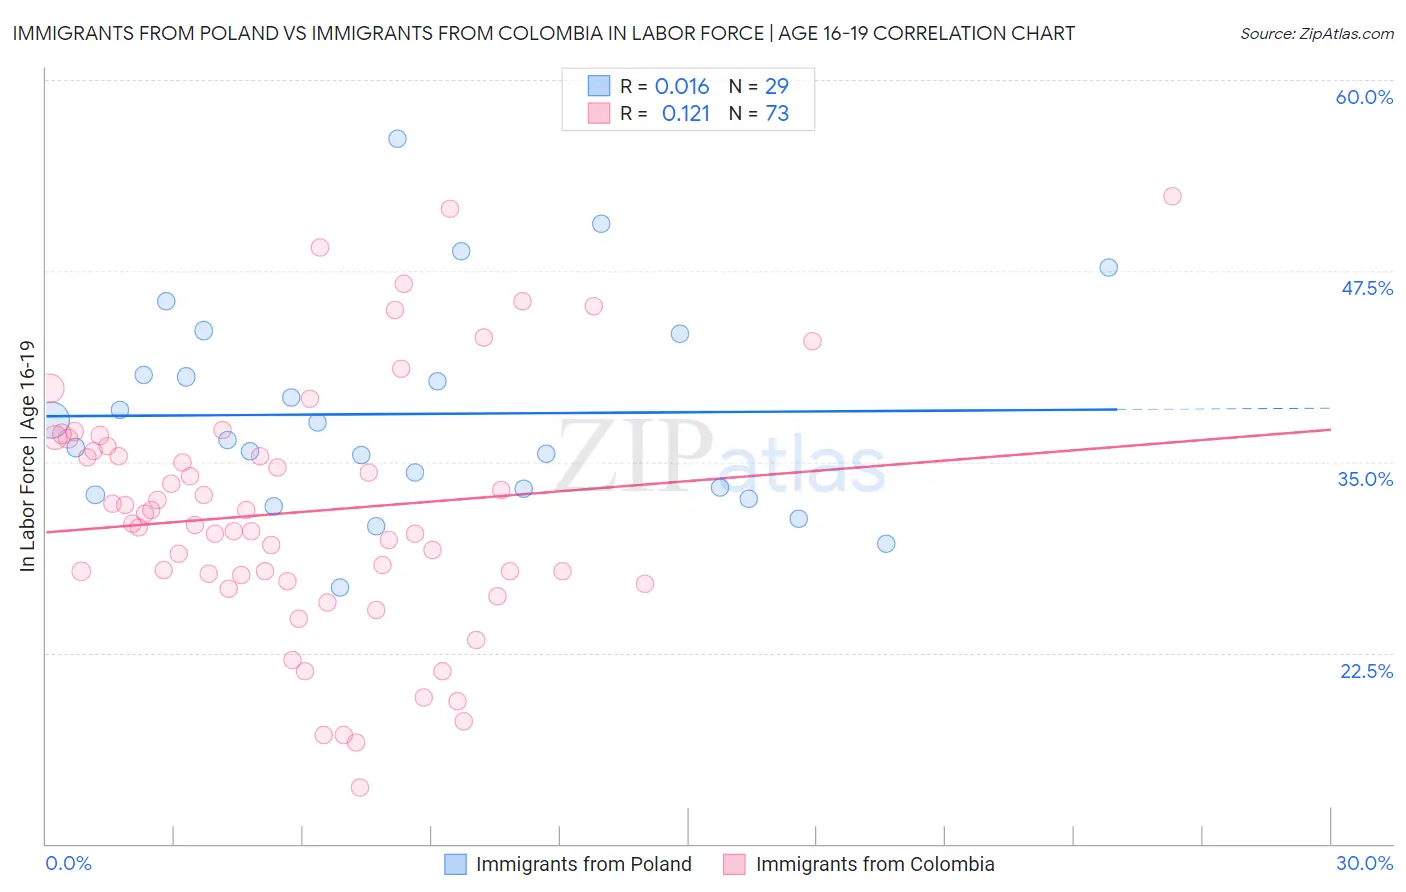
Immigrants from Poland vs Immigrants from Colombia In Labor Force | Age 16-19 Correlation Chart
The statistical analysis conducted on geographies consisting of 304,422,201 people shows no correlation between the proportion of Immigrants from Poland and labor force participation rate among population between the ages 16 and 19 in the United States with a correlation coefficient (R) of 0.016 and weighted average of 37.3%. Similarly, the statistical analysis conducted on geographies consisting of 378,135,615 people shows a poor positive correlation between the proportion of Immigrants from Colombia and labor force participation rate among population between the ages 16 and 19 in the United States with a correlation coefficient (R) of 0.121 and weighted average of 33.5%, a difference of 11.6%.
In Labor Force | Age 16-19 Correlation Summary
| Measurement | Immigrants from Poland | Immigrants from Colombia |
| Minimum | 26.8% | 13.7% |
| Maximum | 56.2% | 52.4% |
| Range | 29.4% | 38.7% |
| Mean | 38.1% | 31.7% |
| Median | 36.4% | 31.0% |
| Interquartile 25% (IQ1) | 33.1% | 27.4% |
| Interquartile 75% (IQ3) | 42.0% | 36.3% |
| Interquartile Range (IQR) | 9.0% | 8.9% |
| Standard Deviation (Sample) | 6.8% | 8.2% |
| Standard Deviation (Population) | 6.7% | 8.1% |
Similar Demographics by In Labor Force | Age 16-19
Demographics Similar to Immigrants from Poland by In Labor Force | Age 16-19
In terms of in labor force | age 16-19, the demographic groups most similar to Immigrants from Poland are Tsimshian (37.4%, a difference of 0.030%), Native Hawaiian (37.4%, a difference of 0.050%), Immigrants from Sierra Leone (37.3%, a difference of 0.070%), Arapaho (37.3%, a difference of 0.23%), and Immigrants from Bulgaria (37.3%, a difference of 0.25%).
| Demographics | Rating | Rank | In Labor Force | Age 16-19 |
| Japanese | 89.3 /100 | #144 | Excellent 37.5% |
| Paiute | 89.3 /100 | #145 | Excellent 37.5% |
| Immigrants | Western Europe | 88.9 /100 | #146 | Excellent 37.5% |
| Brazilians | 88.7 /100 | #147 | Excellent 37.5% |
| Romanians | 87.3 /100 | #148 | Excellent 37.5% |
| Native Hawaiians | 85.0 /100 | #149 | Excellent 37.4% |
| Tsimshian | 84.7 /100 | #150 | Excellent 37.4% |
| Immigrants | Poland | 84.4 /100 | #151 | Excellent 37.3% |
| Immigrants | Sierra Leone | 83.6 /100 | #152 | Excellent 37.3% |
| Arapaho | 81.8 /100 | #153 | Excellent 37.3% |
| Immigrants | Bulgaria | 81.6 /100 | #154 | Excellent 37.3% |
| Immigrants | Lithuania | 80.7 /100 | #155 | Excellent 37.2% |
| Kiowa | 80.4 /100 | #156 | Excellent 37.2% |
| Immigrants | Brazil | 76.5 /100 | #157 | Good 37.1% |
| Ute | 75.7 /100 | #158 | Good 37.1% |
Demographics Similar to Immigrants from Colombia by In Labor Force | Age 16-19
In terms of in labor force | age 16-19, the demographic groups most similar to Immigrants from Colombia are Immigrants from Belarus (33.4%, a difference of 0.080%), Immigrants from Indonesia (33.5%, a difference of 0.14%), Immigrants from Singapore (33.5%, a difference of 0.14%), Haitian (33.4%, a difference of 0.14%), and Nepalese (33.5%, a difference of 0.18%).
| Demographics | Rating | Rank | In Labor Force | Age 16-19 |
| Immigrants | Venezuela | 0.2 /100 | #283 | Tragic 33.7% |
| Immigrants | Spain | 0.2 /100 | #284 | Tragic 33.7% |
| U.S. Virgin Islanders | 0.2 /100 | #285 | Tragic 33.6% |
| South Americans | 0.2 /100 | #286 | Tragic 33.6% |
| Nepalese | 0.1 /100 | #287 | Tragic 33.5% |
| Immigrants | Indonesia | 0.1 /100 | #288 | Tragic 33.5% |
| Immigrants | Singapore | 0.1 /100 | #289 | Tragic 33.5% |
| Immigrants | Colombia | 0.1 /100 | #290 | Tragic 33.5% |
| Immigrants | Belarus | 0.1 /100 | #291 | Tragic 33.4% |
| Haitians | 0.1 /100 | #292 | Tragic 33.4% |
| Immigrants | South America | 0.1 /100 | #293 | Tragic 33.3% |
| Argentineans | 0.1 /100 | #294 | Tragic 33.3% |
| Yup'ik | 0.1 /100 | #295 | Tragic 33.3% |
| Jamaicans | 0.1 /100 | #296 | Tragic 33.2% |
| Immigrants | Haiti | 0.1 /100 | #297 | Tragic 33.2% |