Immigrants from Portugal vs Norwegian In Labor Force | Age 20-24
COMPARE
Immigrants from Portugal
Norwegian
In Labor Force | Age 20-24
In Labor Force | Age 20-24 Comparison
Immigrants from Portugal
Norwegians
75.8%
IN LABOR FORCE | AGE 20-24
94.8/ 100
METRIC RATING
119th/ 347
METRIC RANK
80.1%
IN LABOR FORCE | AGE 20-24
100.0/ 100
METRIC RATING
1st/ 347
METRIC RANK
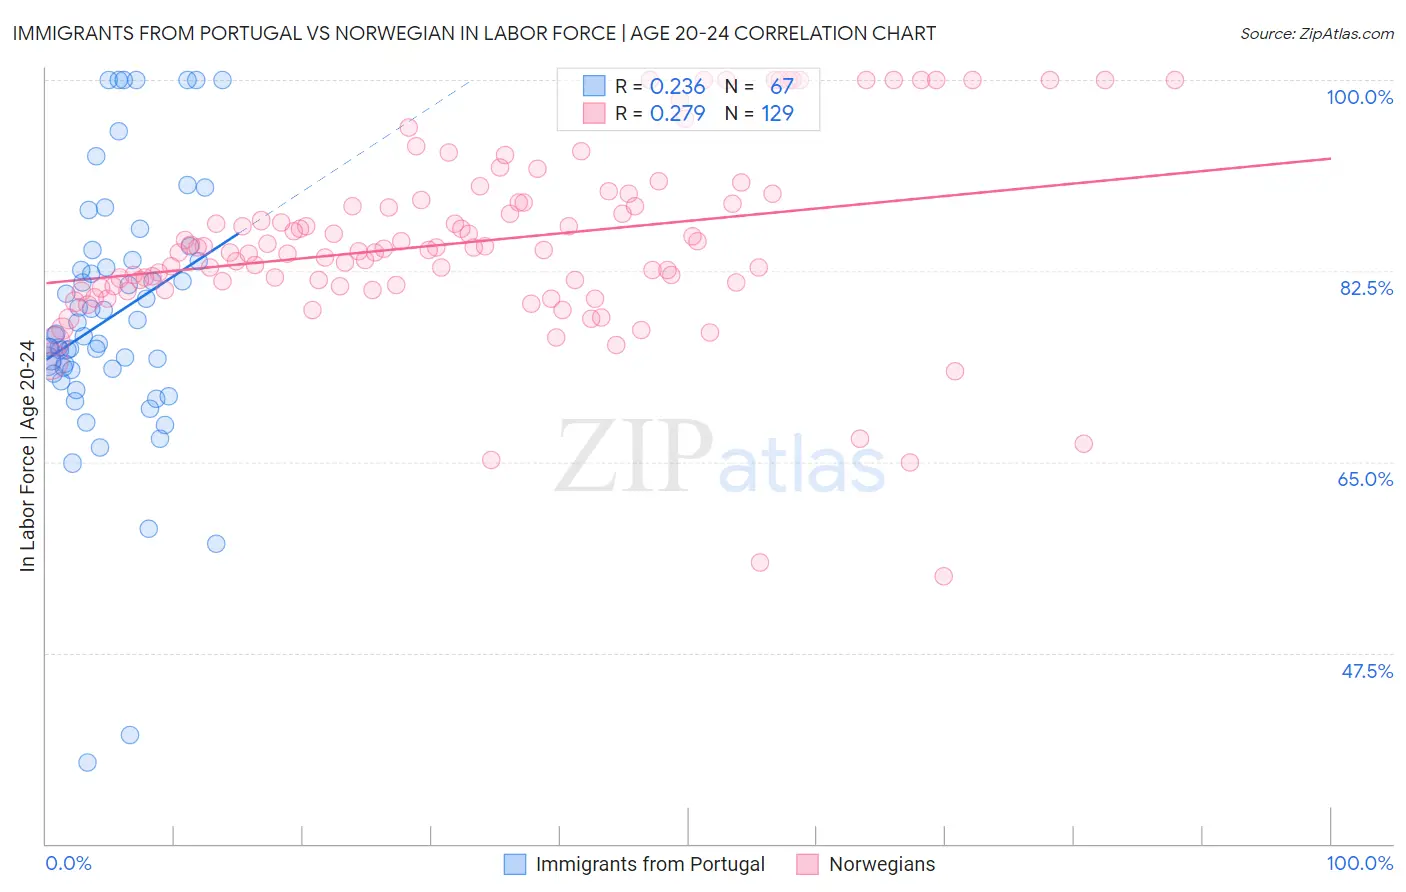
Immigrants from Portugal vs Norwegian In Labor Force | Age 20-24 Correlation Chart
The statistical analysis conducted on geographies consisting of 174,703,744 people shows a weak positive correlation between the proportion of Immigrants from Portugal and labor force participation rate among population between the ages 20 and 24 in the United States with a correlation coefficient (R) of 0.236 and weighted average of 75.8%. Similarly, the statistical analysis conducted on geographies consisting of 532,369,194 people shows a weak positive correlation between the proportion of Norwegians and labor force participation rate among population between the ages 20 and 24 in the United States with a correlation coefficient (R) of 0.279 and weighted average of 80.1%, a difference of 5.7%.
In Labor Force | Age 20-24 Correlation Summary
| Measurement | Immigrants from Portugal | Norwegian |
| Minimum | 37.5% | 54.5% |
| Maximum | 100.0% | 100.0% |
| Range | 62.5% | 45.5% |
| Mean | 78.3% | 85.2% |
| Median | 76.6% | 84.5% |
| Interquartile 25% (IQ1) | 73.5% | 81.1% |
| Interquartile 75% (IQ3) | 83.6% | 88.9% |
| Interquartile Range (IQR) | 10.1% | 7.8% |
| Standard Deviation (Sample) | 12.1% | 8.5% |
| Standard Deviation (Population) | 12.1% | 8.5% |
Similar Demographics by In Labor Force | Age 20-24
Demographics Similar to Immigrants from Portugal by In Labor Force | Age 20-24
In terms of in labor force | age 20-24, the demographic groups most similar to Immigrants from Portugal are Spanish American (75.8%, a difference of 0.0%), Immigrants from North America (75.9%, a difference of 0.010%), Assyrian/Chaldean/Syriac (75.9%, a difference of 0.010%), Immigrants from Africa (75.8%, a difference of 0.010%), and Immigrants from Zimbabwe (75.9%, a difference of 0.020%).
| Demographics | Rating | Rank | In Labor Force | Age 20-24 |
| Immigrants | Canada | 95.6 /100 | #112 | Exceptional 75.9% |
| Immigrants | Netherlands | 95.3 /100 | #113 | Exceptional 75.9% |
| Immigrants | Zimbabwe | 95.1 /100 | #114 | Exceptional 75.9% |
| Alaska Natives | 95.1 /100 | #115 | Exceptional 75.9% |
| Immigrants | North America | 95.0 /100 | #116 | Exceptional 75.9% |
| Assyrians/Chaldeans/Syriacs | 94.9 /100 | #117 | Exceptional 75.9% |
| Spanish Americans | 94.8 /100 | #118 | Exceptional 75.8% |
| Immigrants | Portugal | 94.8 /100 | #119 | Exceptional 75.8% |
| Immigrants | Africa | 94.6 /100 | #120 | Exceptional 75.8% |
| Immigrants | Serbia | 94.3 /100 | #121 | Exceptional 75.8% |
| Pakistanis | 94.1 /100 | #122 | Exceptional 75.8% |
| Immigrants | Bulgaria | 94.1 /100 | #123 | Exceptional 75.8% |
| Immigrants | Sierra Leone | 93.8 /100 | #124 | Exceptional 75.8% |
| Immigrants | Scotland | 93.7 /100 | #125 | Exceptional 75.8% |
| Brazilians | 93.0 /100 | #126 | Exceptional 75.8% |
Demographics Similar to Norwegians by In Labor Force | Age 20-24
In terms of in labor force | age 20-24, the demographic groups most similar to Norwegians are Immigrants from Somalia (79.5%, a difference of 0.76%), Somali (79.3%, a difference of 1.1%), Alaskan Athabascan (79.1%, a difference of 1.3%), Aleut (79.0%, a difference of 1.5%), and Danish (79.0%, a difference of 1.5%).
| Demographics | Rating | Rank | In Labor Force | Age 20-24 |
| Norwegians | 100.0 /100 | #1 | Exceptional 80.1% |
| Immigrants | Somalia | 100.0 /100 | #2 | Exceptional 79.5% |
| Somalis | 100.0 /100 | #3 | Exceptional 79.3% |
| Alaskan Athabascans | 100.0 /100 | #4 | Exceptional 79.1% |
| Aleuts | 100.0 /100 | #5 | Exceptional 79.0% |
| Danes | 100.0 /100 | #6 | Exceptional 79.0% |
| Luxembourgers | 100.0 /100 | #7 | Exceptional 79.0% |
| Immigrants | Cabo Verde | 100.0 /100 | #8 | Exceptional 78.9% |
| Swedes | 100.0 /100 | #9 | Exceptional 78.8% |
| Slovenes | 100.0 /100 | #10 | Exceptional 78.7% |
| Finns | 100.0 /100 | #11 | Exceptional 78.7% |
| Germans | 100.0 /100 | #12 | Exceptional 78.6% |
| Scandinavians | 100.0 /100 | #13 | Exceptional 78.5% |
| Czechs | 100.0 /100 | #14 | Exceptional 78.5% |
| Sudanese | 100.0 /100 | #15 | Exceptional 78.4% |