Puget Sound Salish vs Chinese In Labor Force | Age 20-64
COMPARE
Puget Sound Salish
Chinese
In Labor Force | Age 20-64
In Labor Force | Age 20-64 Comparison
Puget Sound Salish
Chinese
78.2%
IN LABOR FORCE | AGE 20-64
0.0/ 100
METRIC RATING
276th/ 347
METRIC RANK
80.7%
IN LABOR FORCE | AGE 20-64
99.9/ 100
METRIC RATING
33rd/ 347
METRIC RANK
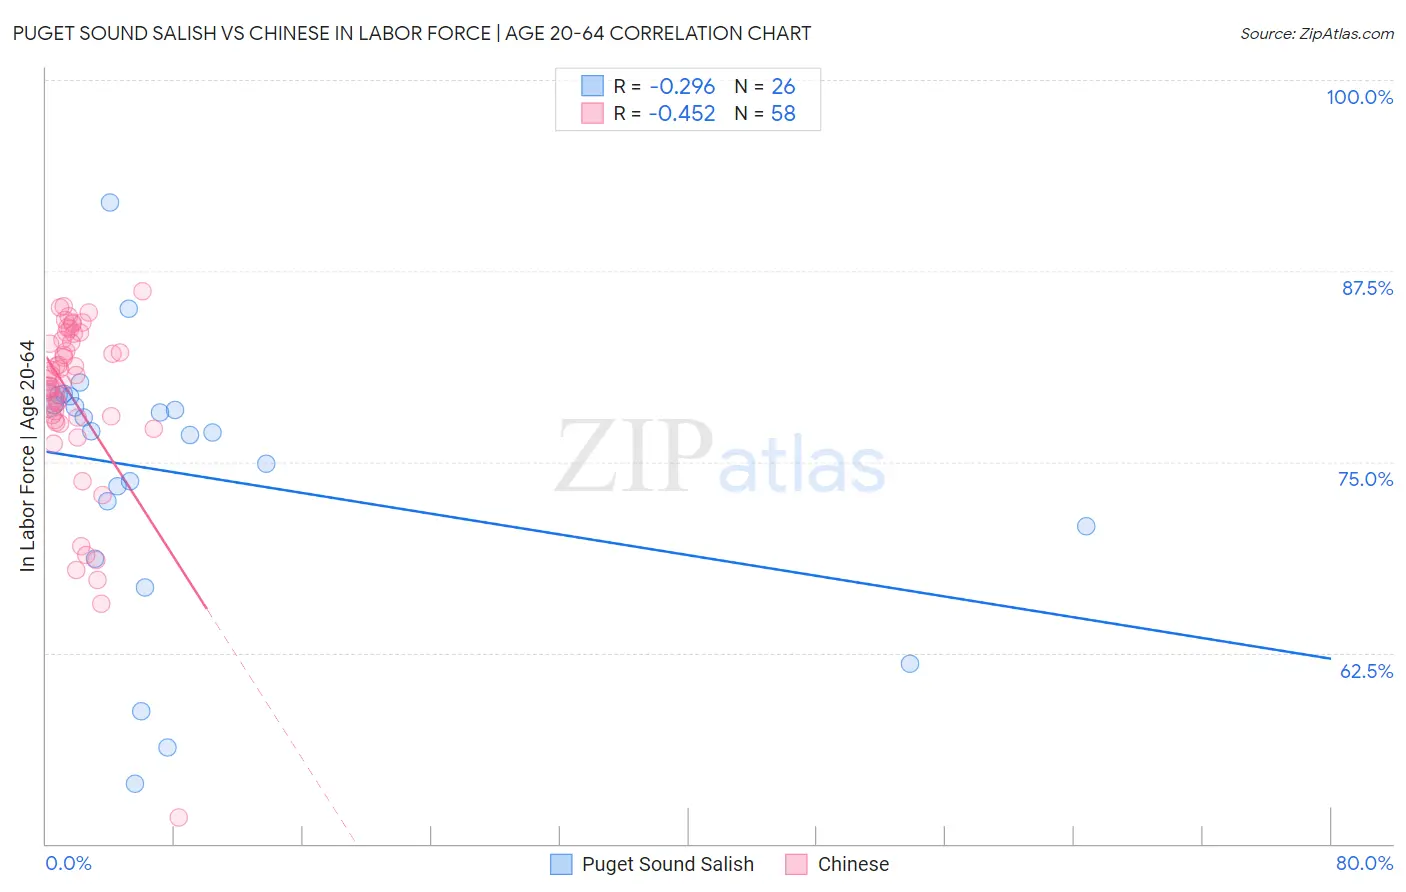
Puget Sound Salish vs Chinese In Labor Force | Age 20-64 Correlation Chart
The statistical analysis conducted on geographies consisting of 46,155,865 people shows a weak negative correlation between the proportion of Puget Sound Salish and labor force participation rate among population between the ages 20 and 64 in the United States with a correlation coefficient (R) of -0.296 and weighted average of 78.2%. Similarly, the statistical analysis conducted on geographies consisting of 64,809,125 people shows a moderate negative correlation between the proportion of Chinese and labor force participation rate among population between the ages 20 and 64 in the United States with a correlation coefficient (R) of -0.452 and weighted average of 80.7%, a difference of 3.2%.
In Labor Force | Age 20-64 Correlation Summary
| Measurement | Puget Sound Salish | Chinese |
| Minimum | 53.9% | 51.7% |
| Maximum | 92.0% | 86.2% |
| Range | 38.1% | 34.5% |
| Mean | 74.2% | 79.0% |
| Median | 77.0% | 80.5% |
| Interquartile 25% (IQ1) | 70.8% | 77.7% |
| Interquartile 75% (IQ3) | 79.0% | 83.0% |
| Interquartile Range (IQR) | 8.2% | 5.3% |
| Standard Deviation (Sample) | 8.7% | 6.1% |
| Standard Deviation (Population) | 8.6% | 6.0% |
Similar Demographics by In Labor Force | Age 20-64
Demographics Similar to Puget Sound Salish by In Labor Force | Age 20-64
In terms of in labor force | age 20-64, the demographic groups most similar to Puget Sound Salish are Spanish (78.2%, a difference of 0.0%), Aleut (78.2%, a difference of 0.010%), Immigrants from Bahamas (78.2%, a difference of 0.010%), Mexican American Indian (78.2%, a difference of 0.020%), and French American Indian (78.2%, a difference of 0.030%).
| Demographics | Rating | Rank | In Labor Force | Age 20-64 |
| Immigrants | Barbados | 0.0 /100 | #269 | Tragic 78.3% |
| Scotch-Irish | 0.0 /100 | #270 | Tragic 78.3% |
| Immigrants | Latin America | 0.0 /100 | #271 | Tragic 78.3% |
| Marshallese | 0.0 /100 | #272 | Tragic 78.3% |
| French American Indians | 0.0 /100 | #273 | Tragic 78.2% |
| Aleuts | 0.0 /100 | #274 | Tragic 78.2% |
| Spanish | 0.0 /100 | #275 | Tragic 78.2% |
| Puget Sound Salish | 0.0 /100 | #276 | Tragic 78.2% |
| Immigrants | Bahamas | 0.0 /100 | #277 | Tragic 78.2% |
| Mexican American Indians | 0.0 /100 | #278 | Tragic 78.2% |
| Belizeans | 0.0 /100 | #279 | Tragic 78.2% |
| Immigrants | Dominica | 0.0 /100 | #280 | Tragic 78.1% |
| Guyanese | 0.0 /100 | #281 | Tragic 78.1% |
| Immigrants | St. Vincent and the Grenadines | 0.0 /100 | #282 | Tragic 78.1% |
| Immigrants | Nonimmigrants | 0.0 /100 | #283 | Tragic 78.1% |
Demographics Similar to Chinese by In Labor Force | Age 20-64
In terms of in labor force | age 20-64, the demographic groups most similar to Chinese are Immigrants from Brazil (80.7%, a difference of 0.020%), Immigrants from Ireland (80.7%, a difference of 0.030%), Immigrants from Lithuania (80.7%, a difference of 0.040%), Immigrants from Poland (80.6%, a difference of 0.050%), and Immigrants from North Macedonia (80.7%, a difference of 0.060%).
| Demographics | Rating | Rank | In Labor Force | Age 20-64 |
| Immigrants | Serbia | 100.0 /100 | #26 | Exceptional 80.8% |
| Immigrants | Kenya | 99.9 /100 | #27 | Exceptional 80.7% |
| Immigrants | Uganda | 99.9 /100 | #28 | Exceptional 80.7% |
| Immigrants | South Central Asia | 99.9 /100 | #29 | Exceptional 80.7% |
| Immigrants | North Macedonia | 99.9 /100 | #30 | Exceptional 80.7% |
| Immigrants | Lithuania | 99.9 /100 | #31 | Exceptional 80.7% |
| Immigrants | Ireland | 99.9 /100 | #32 | Exceptional 80.7% |
| Chinese | 99.9 /100 | #33 | Exceptional 80.7% |
| Immigrants | Brazil | 99.9 /100 | #34 | Exceptional 80.7% |
| Immigrants | Poland | 99.9 /100 | #35 | Exceptional 80.6% |
| Paraguayans | 99.8 /100 | #36 | Exceptional 80.6% |
| Immigrants | Moldova | 99.8 /100 | #37 | Exceptional 80.6% |
| Ugandans | 99.8 /100 | #38 | Exceptional 80.6% |
| Brazilians | 99.8 /100 | #39 | Exceptional 80.5% |
| Immigrants | Zimbabwe | 99.8 /100 | #40 | Exceptional 80.5% |