Portuguese vs Soviet Union In Labor Force | Age 35-44
COMPARE
Portuguese
Soviet Union
In Labor Force | Age 35-44
In Labor Force | Age 35-44 Comparison
Portuguese
Soviet Union
84.3%
IN LABOR FORCE | AGE 35-44
31.9/ 100
METRIC RATING
190th/ 347
METRIC RANK
85.1%
IN LABOR FORCE | AGE 35-44
99.5/ 100
METRIC RATING
55th/ 347
METRIC RANK
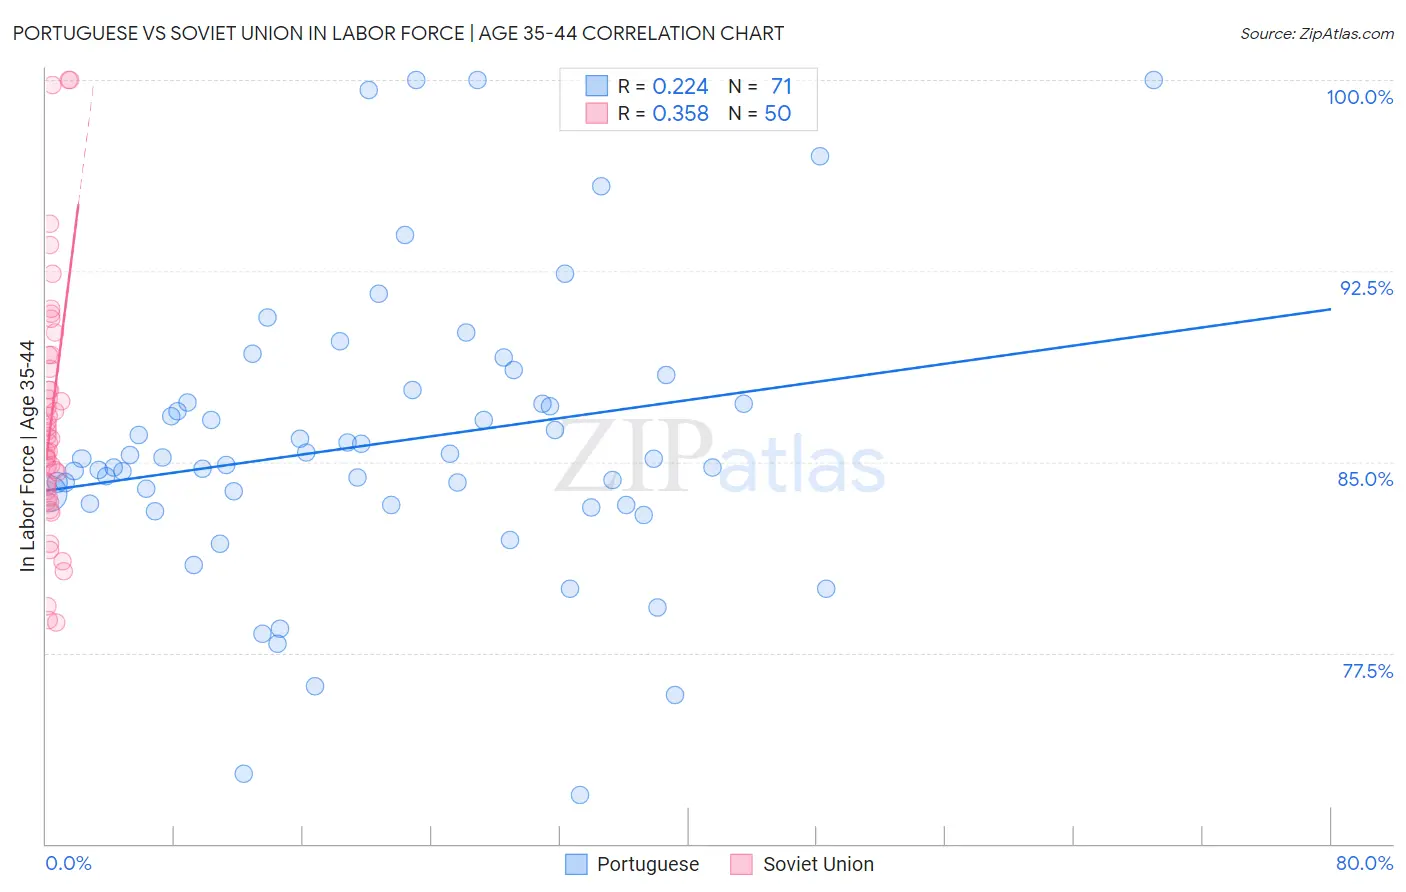
Portuguese vs Soviet Union In Labor Force | Age 35-44 Correlation Chart
The statistical analysis conducted on geographies consisting of 450,031,127 people shows a weak positive correlation between the proportion of Portuguese and labor force participation rate among population between the ages 35 and 44 in the United States with a correlation coefficient (R) of 0.224 and weighted average of 84.3%. Similarly, the statistical analysis conducted on geographies consisting of 43,512,203 people shows a mild positive correlation between the proportion of Soviet Union and labor force participation rate among population between the ages 35 and 44 in the United States with a correlation coefficient (R) of 0.358 and weighted average of 85.1%, a difference of 0.98%.
In Labor Force | Age 35-44 Correlation Summary
| Measurement | Portuguese | Soviet Union |
| Minimum | 71.9% | 78.7% |
| Maximum | 100.0% | 100.0% |
| Range | 28.1% | 21.3% |
| Mean | 85.7% | 86.7% |
| Median | 85.1% | 85.8% |
| Interquartile 25% (IQ1) | 83.3% | 83.9% |
| Interquartile 75% (IQ3) | 87.3% | 88.6% |
| Interquartile Range (IQR) | 4.0% | 4.8% |
| Standard Deviation (Sample) | 5.7% | 4.8% |
| Standard Deviation (Population) | 5.6% | 4.8% |
Similar Demographics by In Labor Force | Age 35-44
Demographics Similar to Portuguese by In Labor Force | Age 35-44
In terms of in labor force | age 35-44, the demographic groups most similar to Portuguese are Immigrants from Denmark (84.3%, a difference of 0.010%), Costa Rican (84.3%, a difference of 0.020%), Australian (84.3%, a difference of 0.020%), Dutch (84.3%, a difference of 0.020%), and South African (84.3%, a difference of 0.020%).
| Demographics | Rating | Rank | In Labor Force | Age 35-44 |
| Barbadians | 36.2 /100 | #183 | Fair 84.3% |
| Armenians | 35.6 /100 | #184 | Fair 84.3% |
| Costa Ricans | 35.3 /100 | #185 | Fair 84.3% |
| Australians | 35.1 /100 | #186 | Fair 84.3% |
| Dutch | 34.8 /100 | #187 | Fair 84.3% |
| South Africans | 34.1 /100 | #188 | Fair 84.3% |
| Immigrants | Denmark | 33.7 /100 | #189 | Fair 84.3% |
| Portuguese | 31.9 /100 | #190 | Fair 84.3% |
| Immigrants | Philippines | 27.9 /100 | #191 | Fair 84.2% |
| Immigrants | Vietnam | 27.4 /100 | #192 | Fair 84.2% |
| Hungarians | 26.8 /100 | #193 | Fair 84.2% |
| Immigrants | Indonesia | 25.7 /100 | #194 | Fair 84.2% |
| Immigrants | Caribbean | 25.7 /100 | #195 | Fair 84.2% |
| Immigrants | England | 25.0 /100 | #196 | Fair 84.2% |
| Immigrants | Western Europe | 24.7 /100 | #197 | Fair 84.2% |
Demographics Similar to Soviet Union by In Labor Force | Age 35-44
In terms of in labor force | age 35-44, the demographic groups most similar to Soviet Union are Turkish (85.1%, a difference of 0.0%), Immigrants from Croatia (85.1%, a difference of 0.010%), Taiwanese (85.1%, a difference of 0.020%), Immigrants from Kenya (85.1%, a difference of 0.030%), and Chinese (85.1%, a difference of 0.030%).
| Demographics | Rating | Rank | In Labor Force | Age 35-44 |
| Immigrants | Eritrea | 99.7 /100 | #48 | Exceptional 85.2% |
| Croatians | 99.7 /100 | #49 | Exceptional 85.2% |
| Thais | 99.7 /100 | #50 | Exceptional 85.2% |
| Immigrants | Albania | 99.7 /100 | #51 | Exceptional 85.1% |
| Immigrants | Kenya | 99.6 /100 | #52 | Exceptional 85.1% |
| Taiwanese | 99.6 /100 | #53 | Exceptional 85.1% |
| Turks | 99.5 /100 | #54 | Exceptional 85.1% |
| Soviet Union | 99.5 /100 | #55 | Exceptional 85.1% |
| Immigrants | Croatia | 99.5 /100 | #56 | Exceptional 85.1% |
| Chinese | 99.4 /100 | #57 | Exceptional 85.1% |
| Slovaks | 99.4 /100 | #58 | Exceptional 85.1% |
| Serbians | 99.4 /100 | #59 | Exceptional 85.1% |
| Albanians | 99.4 /100 | #60 | Exceptional 85.1% |
| Immigrants | Latvia | 99.3 /100 | #61 | Exceptional 85.0% |
| Immigrants | Moldova | 99.3 /100 | #62 | Exceptional 85.0% |