Immigrants from Dominica vs Soviet Union In Labor Force | Age 35-44
COMPARE
Immigrants from Dominica
Soviet Union
In Labor Force | Age 35-44
In Labor Force | Age 35-44 Comparison
Immigrants from Dominica
Soviet Union
83.5%
IN LABOR FORCE | AGE 35-44
0.2/ 100
METRIC RATING
261st/ 347
METRIC RANK
85.1%
IN LABOR FORCE | AGE 35-44
99.5/ 100
METRIC RATING
55th/ 347
METRIC RANK
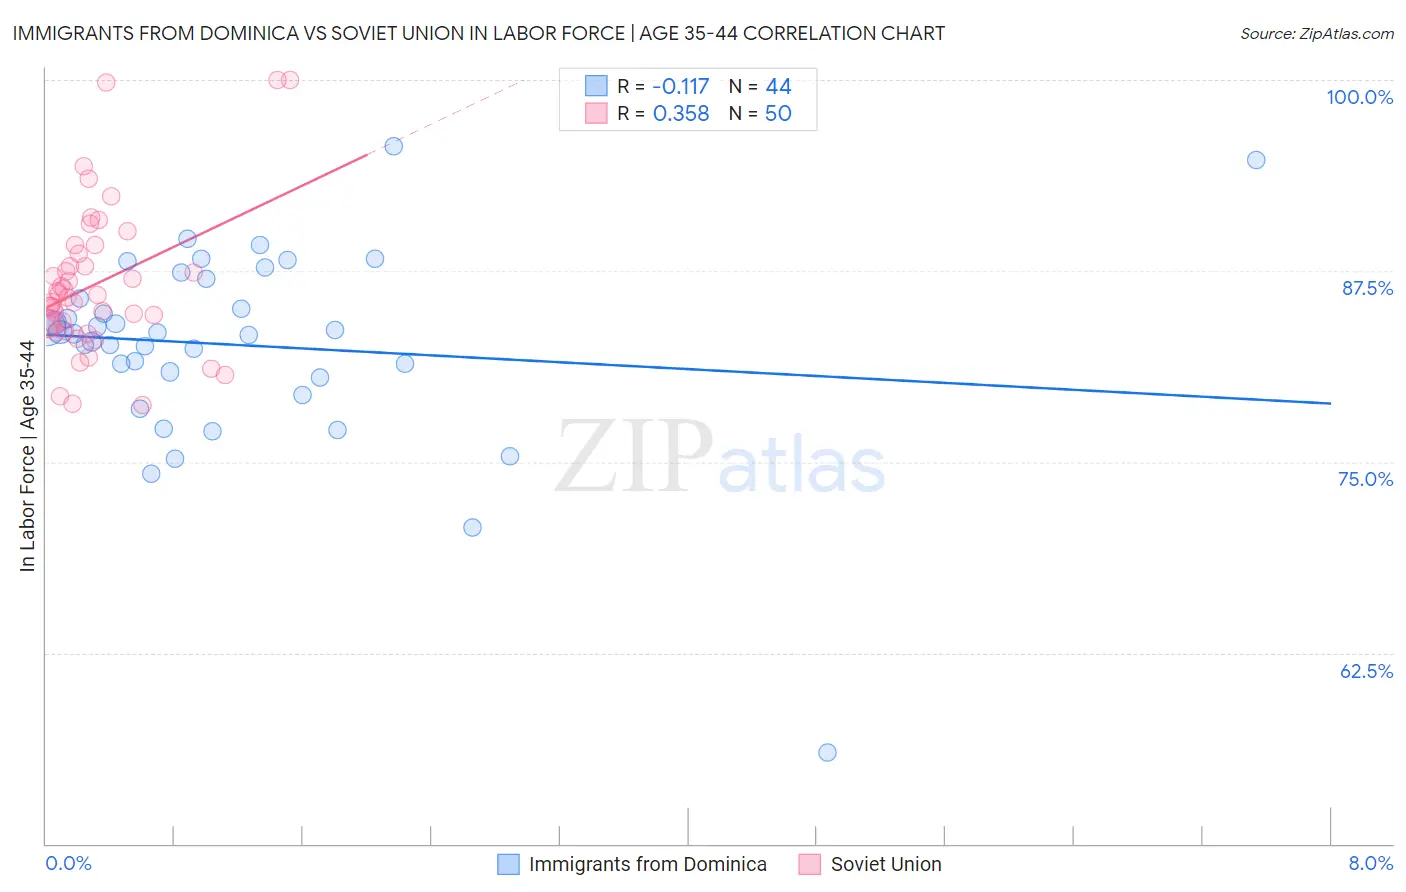
Immigrants from Dominica vs Soviet Union In Labor Force | Age 35-44 Correlation Chart
The statistical analysis conducted on geographies consisting of 83,785,416 people shows a poor negative correlation between the proportion of Immigrants from Dominica and labor force participation rate among population between the ages 35 and 44 in the United States with a correlation coefficient (R) of -0.117 and weighted average of 83.5%. Similarly, the statistical analysis conducted on geographies consisting of 43,512,203 people shows a mild positive correlation between the proportion of Soviet Union and labor force participation rate among population between the ages 35 and 44 in the United States with a correlation coefficient (R) of 0.358 and weighted average of 85.1%, a difference of 1.9%.
In Labor Force | Age 35-44 Correlation Summary
| Measurement | Immigrants from Dominica | Soviet Union |
| Minimum | 56.0% | 78.7% |
| Maximum | 95.7% | 100.0% |
| Range | 39.7% | 21.3% |
| Mean | 82.7% | 86.7% |
| Median | 83.4% | 85.8% |
| Interquartile 25% (IQ1) | 80.7% | 83.9% |
| Interquartile 75% (IQ3) | 86.4% | 88.6% |
| Interquartile Range (IQR) | 5.7% | 4.8% |
| Standard Deviation (Sample) | 6.5% | 4.8% |
| Standard Deviation (Population) | 6.4% | 4.8% |
Similar Demographics by In Labor Force | Age 35-44
Demographics Similar to Immigrants from Dominica by In Labor Force | Age 35-44
In terms of in labor force | age 35-44, the demographic groups most similar to Immigrants from Dominica are Vietnamese (83.5%, a difference of 0.0%), Immigrants from El Salvador (83.5%, a difference of 0.010%), Immigrants from Congo (83.5%, a difference of 0.010%), Iroquois (83.5%, a difference of 0.030%), and Tsimshian (83.5%, a difference of 0.040%).
| Demographics | Rating | Rank | In Labor Force | Age 35-44 |
| Tongans | 0.4 /100 | #254 | Tragic 83.6% |
| Immigrants | Azores | 0.3 /100 | #255 | Tragic 83.6% |
| Japanese | 0.3 /100 | #256 | Tragic 83.6% |
| Basques | 0.3 /100 | #257 | Tragic 83.6% |
| Tsimshian | 0.2 /100 | #258 | Tragic 83.5% |
| Immigrants | El Salvador | 0.2 /100 | #259 | Tragic 83.5% |
| Vietnamese | 0.2 /100 | #260 | Tragic 83.5% |
| Immigrants | Dominica | 0.2 /100 | #261 | Tragic 83.5% |
| Immigrants | Congo | 0.2 /100 | #262 | Tragic 83.5% |
| Iroquois | 0.2 /100 | #263 | Tragic 83.5% |
| Scotch-Irish | 0.1 /100 | #264 | Tragic 83.5% |
| Central Americans | 0.1 /100 | #265 | Tragic 83.5% |
| Spaniards | 0.1 /100 | #266 | Tragic 83.4% |
| Guamanians/Chamorros | 0.1 /100 | #267 | Tragic 83.4% |
| Hondurans | 0.1 /100 | #268 | Tragic 83.4% |
Demographics Similar to Soviet Union by In Labor Force | Age 35-44
In terms of in labor force | age 35-44, the demographic groups most similar to Soviet Union are Turkish (85.1%, a difference of 0.0%), Immigrants from Croatia (85.1%, a difference of 0.010%), Taiwanese (85.1%, a difference of 0.020%), Immigrants from Kenya (85.1%, a difference of 0.030%), and Chinese (85.1%, a difference of 0.030%).
| Demographics | Rating | Rank | In Labor Force | Age 35-44 |
| Immigrants | Eritrea | 99.7 /100 | #48 | Exceptional 85.2% |
| Croatians | 99.7 /100 | #49 | Exceptional 85.2% |
| Thais | 99.7 /100 | #50 | Exceptional 85.2% |
| Immigrants | Albania | 99.7 /100 | #51 | Exceptional 85.1% |
| Immigrants | Kenya | 99.6 /100 | #52 | Exceptional 85.1% |
| Taiwanese | 99.6 /100 | #53 | Exceptional 85.1% |
| Turks | 99.5 /100 | #54 | Exceptional 85.1% |
| Soviet Union | 99.5 /100 | #55 | Exceptional 85.1% |
| Immigrants | Croatia | 99.5 /100 | #56 | Exceptional 85.1% |
| Chinese | 99.4 /100 | #57 | Exceptional 85.1% |
| Slovaks | 99.4 /100 | #58 | Exceptional 85.1% |
| Serbians | 99.4 /100 | #59 | Exceptional 85.1% |
| Albanians | 99.4 /100 | #60 | Exceptional 85.1% |
| Immigrants | Latvia | 99.3 /100 | #61 | Exceptional 85.0% |
| Immigrants | Moldova | 99.3 /100 | #62 | Exceptional 85.0% |