Pakistani vs Danish High School Diploma
COMPARE
Pakistani
Danish
High School Diploma
High School Diploma Comparison
Pakistanis
Danes
89.6%
HIGH SCHOOL DIPLOMA
78.3/ 100
METRIC RATING
143rd/ 347
METRIC RANK
91.8%
HIGH SCHOOL DIPLOMA
100.0/ 100
METRIC RATING
13th/ 347
METRIC RANK
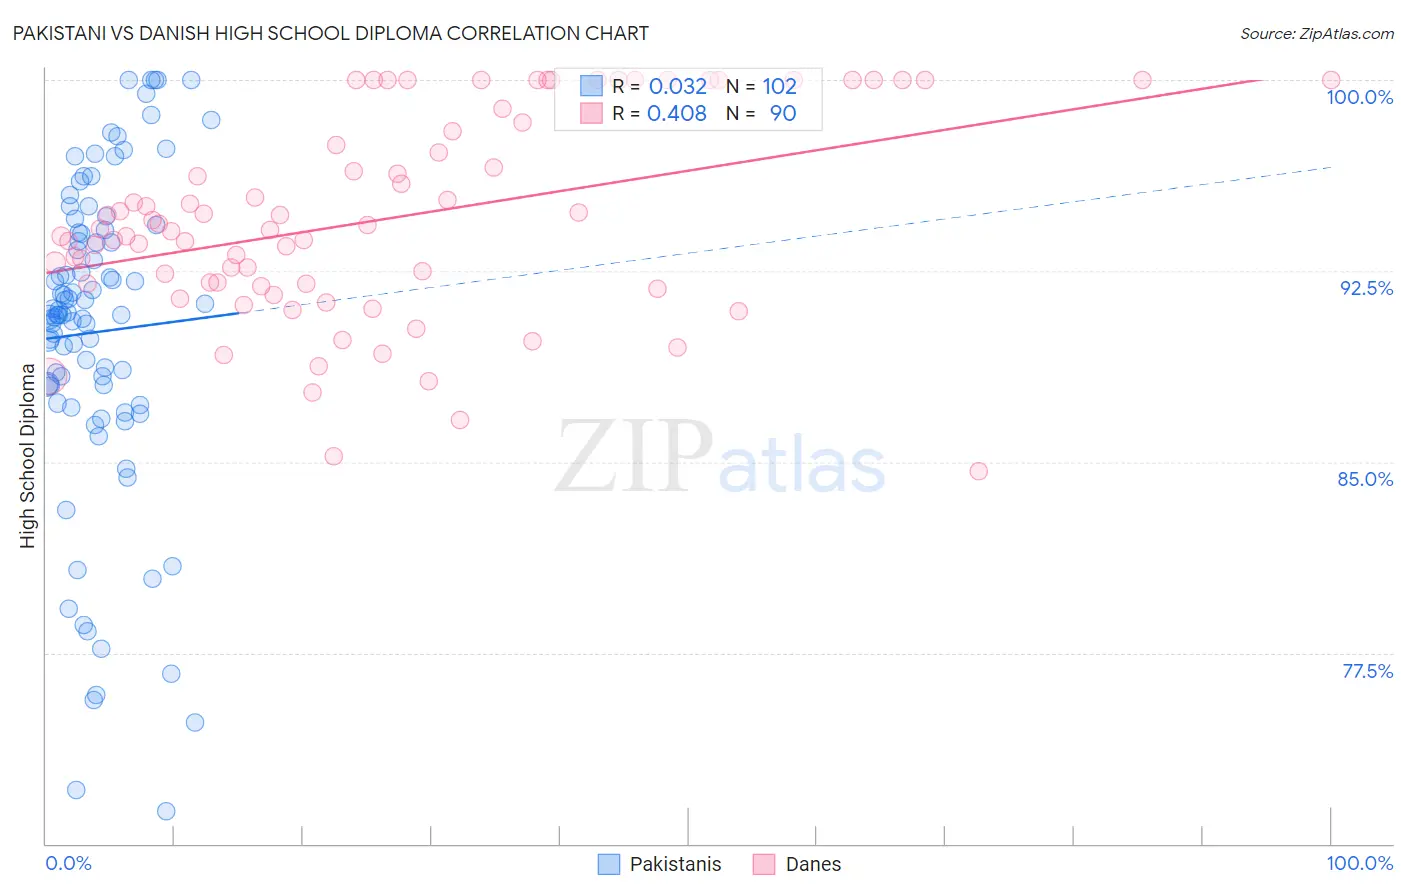
Pakistani vs Danish High School Diploma Correlation Chart
The statistical analysis conducted on geographies consisting of 335,356,437 people shows no correlation between the proportion of Pakistanis and percentage of population with at least high school diploma education in the United States with a correlation coefficient (R) of 0.032 and weighted average of 89.6%. Similarly, the statistical analysis conducted on geographies consisting of 474,193,674 people shows a moderate positive correlation between the proportion of Danes and percentage of population with at least high school diploma education in the United States with a correlation coefficient (R) of 0.408 and weighted average of 91.8%, a difference of 2.5%.
High School Diploma Correlation Summary
| Measurement | Pakistani | Danish |
| Minimum | 71.3% | 84.6% |
| Maximum | 100.0% | 100.0% |
| Range | 28.7% | 15.4% |
| Mean | 90.1% | 94.5% |
| Median | 90.8% | 94.1% |
| Interquartile 25% (IQ1) | 88.0% | 92.0% |
| Interquartile 75% (IQ3) | 94.0% | 98.3% |
| Interquartile Range (IQR) | 6.0% | 6.4% |
| Standard Deviation (Sample) | 6.3% | 4.0% |
| Standard Deviation (Population) | 6.3% | 4.0% |
Similar Demographics by High School Diploma
Demographics Similar to Pakistanis by High School Diploma
In terms of high school diploma, the demographic groups most similar to Pakistanis are Indian (Asian) (89.6%, a difference of 0.010%), Immigrants from Kenya (89.6%, a difference of 0.010%), Chilean (89.6%, a difference of 0.020%), Immigrants from Brazil (89.5%, a difference of 0.040%), and Immigrants from Spain (89.5%, a difference of 0.050%).
| Demographics | Rating | Rank | High School Diploma |
| Ugandans | 83.7 /100 | #136 | Excellent 89.7% |
| Arabs | 83.6 /100 | #137 | Excellent 89.7% |
| Assyrians/Chaldeans/Syriacs | 82.5 /100 | #138 | Excellent 89.7% |
| Kenyans | 81.4 /100 | #139 | Excellent 89.6% |
| Immigrants | Egypt | 81.2 /100 | #140 | Excellent 89.6% |
| Chileans | 79.0 /100 | #141 | Good 89.6% |
| Indians (Asian) | 78.8 /100 | #142 | Good 89.6% |
| Pakistanis | 78.3 /100 | #143 | Good 89.6% |
| Immigrants | Kenya | 78.0 /100 | #144 | Good 89.6% |
| Immigrants | Brazil | 76.6 /100 | #145 | Good 89.5% |
| Immigrants | Spain | 76.2 /100 | #146 | Good 89.5% |
| Iraqis | 73.9 /100 | #147 | Good 89.5% |
| Immigrants | Lebanon | 73.4 /100 | #148 | Good 89.5% |
| Immigrants | Poland | 72.9 /100 | #149 | Good 89.5% |
| Argentineans | 72.3 /100 | #150 | Good 89.5% |
Demographics Similar to Danes by High School Diploma
In terms of high school diploma, the demographic groups most similar to Danes are Polish (91.9%, a difference of 0.050%), Bulgarian (91.8%, a difference of 0.050%), Luxembourger (91.7%, a difference of 0.080%), Eastern European (91.9%, a difference of 0.090%), and Finnish (91.7%, a difference of 0.10%).
| Demographics | Rating | Rank | High School Diploma |
| Slovaks | 100.0 /100 | #6 | Exceptional 92.0% |
| Immigrants | India | 100.0 /100 | #7 | Exceptional 92.0% |
| Chinese | 100.0 /100 | #8 | Exceptional 92.0% |
| Latvians | 100.0 /100 | #9 | Exceptional 92.0% |
| Croatians | 100.0 /100 | #10 | Exceptional 92.0% |
| Eastern Europeans | 100.0 /100 | #11 | Exceptional 91.9% |
| Poles | 100.0 /100 | #12 | Exceptional 91.9% |
| Danes | 100.0 /100 | #13 | Exceptional 91.8% |
| Bulgarians | 100.0 /100 | #14 | Exceptional 91.8% |
| Luxembourgers | 100.0 /100 | #15 | Exceptional 91.7% |
| Finns | 100.0 /100 | #16 | Exceptional 91.7% |
| Immigrants | Singapore | 99.9 /100 | #17 | Exceptional 91.7% |
| Germans | 99.9 /100 | #18 | Exceptional 91.7% |
| Maltese | 99.9 /100 | #19 | Exceptional 91.6% |
| Czechs | 99.9 /100 | #20 | Exceptional 91.6% |