Navajo vs Cape Verdean In Labor Force | Age 20-64
COMPARE
Navajo
Cape Verdean
In Labor Force | Age 20-64
In Labor Force | Age 20-64 Comparison
Navajo
Cape Verdeans
69.2%
IN LABOR FORCE | AGE 20-64
0.0/ 100
METRIC RATING
346th/ 347
METRIC RANK
80.0%
IN LABOR FORCE | AGE 20-64
92.7/ 100
METRIC RATING
118th/ 347
METRIC RANK
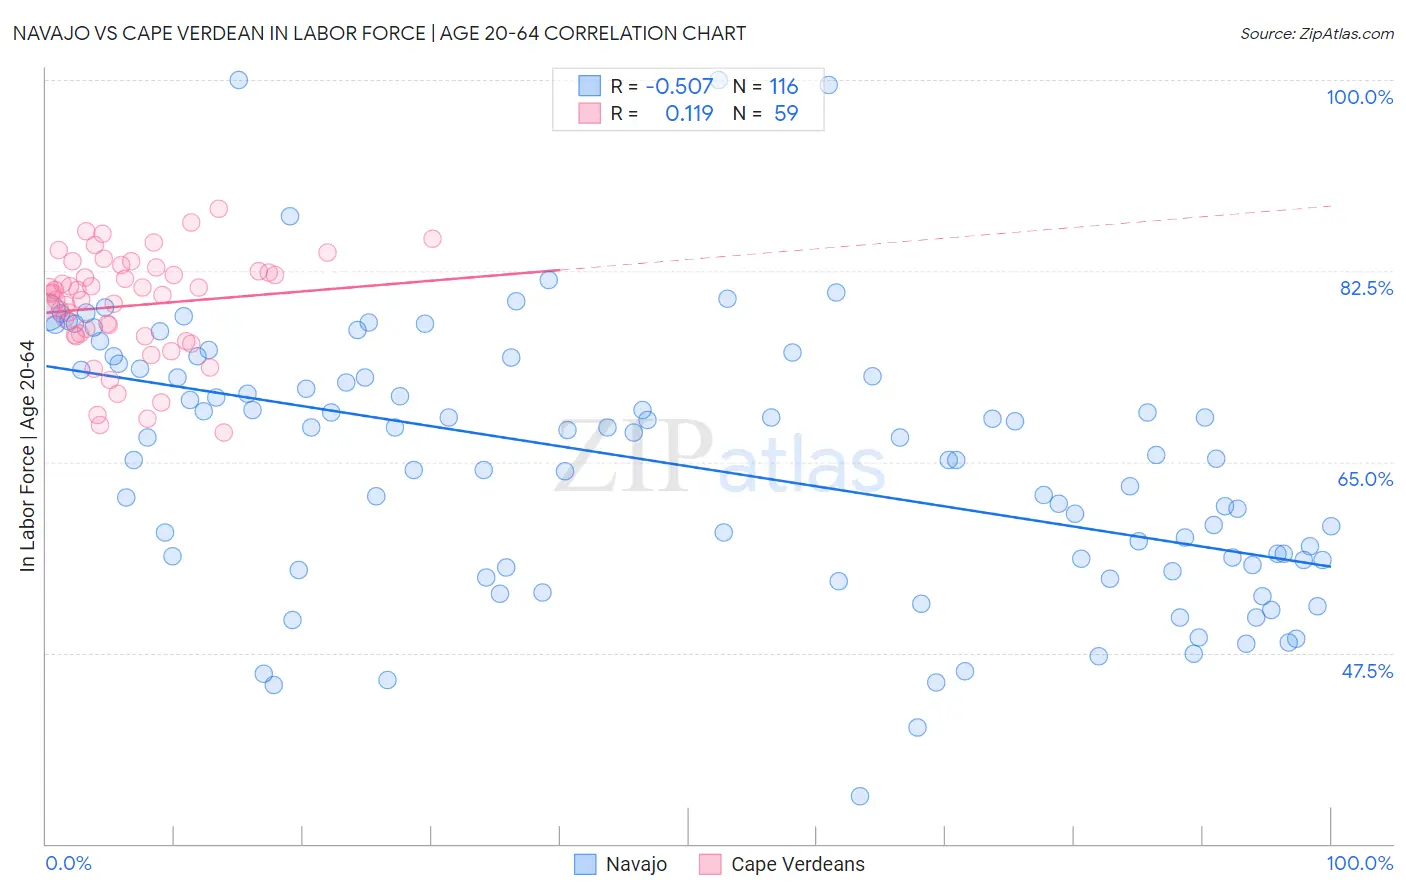
Navajo vs Cape Verdean In Labor Force | Age 20-64 Correlation Chart
The statistical analysis conducted on geographies consisting of 224,851,077 people shows a substantial negative correlation between the proportion of Navajo and labor force participation rate among population between the ages 20 and 64 in the United States with a correlation coefficient (R) of -0.507 and weighted average of 69.2%. Similarly, the statistical analysis conducted on geographies consisting of 107,579,889 people shows a poor positive correlation between the proportion of Cape Verdeans and labor force participation rate among population between the ages 20 and 64 in the United States with a correlation coefficient (R) of 0.119 and weighted average of 80.0%, a difference of 15.6%.
In Labor Force | Age 20-64 Correlation Summary
| Measurement | Navajo | Cape Verdean |
| Minimum | 34.4% | 67.7% |
| Maximum | 100.0% | 88.2% |
| Range | 65.6% | 20.5% |
| Mean | 64.9% | 79.3% |
| Median | 65.5% | 80.4% |
| Interquartile 25% (IQ1) | 55.8% | 76.5% |
| Interquartile 75% (IQ3) | 73.5% | 82.5% |
| Interquartile Range (IQR) | 17.7% | 6.0% |
| Standard Deviation (Sample) | 12.3% | 4.8% |
| Standard Deviation (Population) | 12.2% | 4.8% |
Similar Demographics by In Labor Force | Age 20-64
Demographics Similar to Navajo by In Labor Force | Age 20-64
In terms of in labor force | age 20-64, the demographic groups most similar to Navajo are Pima (69.0%, a difference of 0.16%), Tohono O'odham (70.4%, a difference of 1.8%), Lumbee (70.6%, a difference of 2.1%), Hopi (71.7%, a difference of 3.7%), and Yuman (71.7%, a difference of 3.7%).
| Demographics | Rating | Rank | In Labor Force | Age 20-64 |
| Natives/Alaskans | 0.0 /100 | #333 | Tragic 73.9% |
| Apache | 0.0 /100 | #334 | Tragic 73.7% |
| Ute | 0.0 /100 | #335 | Tragic 73.7% |
| Crow | 0.0 /100 | #336 | Tragic 73.3% |
| Yup'ik | 0.0 /100 | #337 | Tragic 73.2% |
| Puerto Ricans | 0.0 /100 | #338 | Tragic 73.1% |
| Houma | 0.0 /100 | #339 | Tragic 72.7% |
| Pueblo | 0.0 /100 | #340 | Tragic 72.6% |
| Immigrants | Yemen | 0.0 /100 | #341 | Tragic 72.3% |
| Yuman | 0.0 /100 | #342 | Tragic 71.7% |
| Hopi | 0.0 /100 | #343 | Tragic 71.7% |
| Lumbee | 0.0 /100 | #344 | Tragic 70.6% |
| Tohono O'odham | 0.0 /100 | #345 | Tragic 70.4% |
| Navajo | 0.0 /100 | #346 | Tragic 69.2% |
| Pima | 0.0 /100 | #347 | Tragic 69.0% |
Demographics Similar to Cape Verdeans by In Labor Force | Age 20-64
In terms of in labor force | age 20-64, the demographic groups most similar to Cape Verdeans are Immigrants from Vietnam (80.0%, a difference of 0.0%), Immigrants from Western Africa (80.0%, a difference of 0.010%), Immigrants from Taiwan (80.0%, a difference of 0.010%), Maltese (80.0%, a difference of 0.010%), and Immigrants from Kuwait (80.0%, a difference of 0.010%).
| Demographics | Rating | Rank | In Labor Force | Age 20-64 |
| Immigrants | South America | 93.9 /100 | #111 | Exceptional 80.0% |
| Immigrants | Italy | 93.9 /100 | #112 | Exceptional 80.0% |
| Sri Lankans | 93.9 /100 | #113 | Exceptional 80.0% |
| Argentineans | 93.8 /100 | #114 | Exceptional 80.0% |
| Bermudans | 93.3 /100 | #115 | Exceptional 80.0% |
| Immigrants | Western Africa | 93.1 /100 | #116 | Exceptional 80.0% |
| Immigrants | Vietnam | 92.7 /100 | #117 | Exceptional 80.0% |
| Cape Verdeans | 92.7 /100 | #118 | Exceptional 80.0% |
| Immigrants | Taiwan | 92.5 /100 | #119 | Exceptional 80.0% |
| Maltese | 92.4 /100 | #120 | Exceptional 80.0% |
| Immigrants | Kuwait | 92.2 /100 | #121 | Exceptional 80.0% |
| Mongolians | 92.0 /100 | #122 | Exceptional 79.9% |
| Immigrants | Russia | 91.8 /100 | #123 | Exceptional 79.9% |
| Immigrants | Europe | 91.6 /100 | #124 | Exceptional 79.9% |
| Danes | 91.5 /100 | #125 | Exceptional 79.9% |