Moroccan vs Maltese In Labor Force | Age 20-64
COMPARE
Moroccan
Maltese
In Labor Force | Age 20-64
In Labor Force | Age 20-64 Comparison
Moroccans
Maltese
79.7%
IN LABOR FORCE | AGE 20-64
66.7/ 100
METRIC RATING
160th/ 347
METRIC RANK
80.0%
IN LABOR FORCE | AGE 20-64
92.4/ 100
METRIC RATING
120th/ 347
METRIC RANK
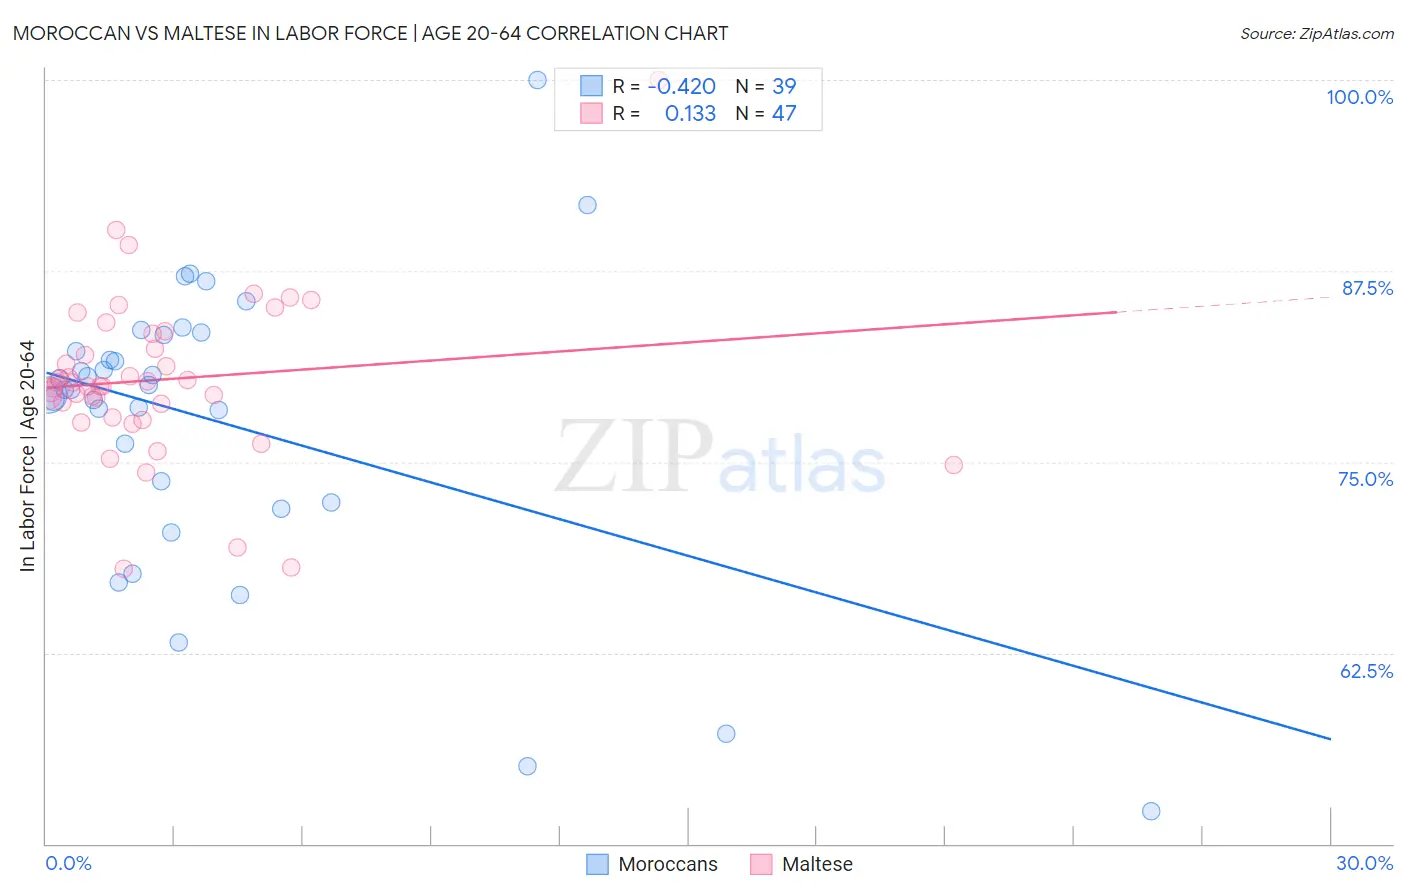
Moroccan vs Maltese In Labor Force | Age 20-64 Correlation Chart
The statistical analysis conducted on geographies consisting of 201,807,372 people shows a moderate negative correlation between the proportion of Moroccans and labor force participation rate among population between the ages 20 and 64 in the United States with a correlation coefficient (R) of -0.420 and weighted average of 79.7%. Similarly, the statistical analysis conducted on geographies consisting of 126,477,906 people shows a poor positive correlation between the proportion of Maltese and labor force participation rate among population between the ages 20 and 64 in the United States with a correlation coefficient (R) of 0.133 and weighted average of 80.0%, a difference of 0.36%.
In Labor Force | Age 20-64 Correlation Summary
| Measurement | Moroccan | Maltese |
| Minimum | 52.1% | 68.0% |
| Maximum | 100.0% | 100.0% |
| Range | 47.9% | 32.0% |
| Mean | 77.6% | 80.4% |
| Median | 79.7% | 79.9% |
| Interquartile 25% (IQ1) | 72.3% | 77.9% |
| Interquartile 75% (IQ3) | 83.3% | 83.4% |
| Interquartile Range (IQR) | 11.0% | 5.5% |
| Standard Deviation (Sample) | 9.7% | 5.4% |
| Standard Deviation (Population) | 9.5% | 5.4% |
Similar Demographics by In Labor Force | Age 20-64
Demographics Similar to Moroccans by In Labor Force | Age 20-64
In terms of in labor force | age 20-64, the demographic groups most similar to Moroccans are Immigrants from Cuba (79.7%, a difference of 0.0%), South African (79.7%, a difference of 0.0%), Austrian (79.7%, a difference of 0.010%), German (79.7%, a difference of 0.010%), and Immigrants from South Africa (79.7%, a difference of 0.020%).
| Demographics | Rating | Rank | In Labor Force | Age 20-64 |
| Immigrants | Kazakhstan | 69.5 /100 | #153 | Good 79.7% |
| New Zealanders | 69.4 /100 | #154 | Good 79.7% |
| Immigrants | South Africa | 69.2 /100 | #155 | Good 79.7% |
| Senegalese | 69.1 /100 | #156 | Good 79.7% |
| Immigrants | China | 69.1 /100 | #157 | Good 79.7% |
| Austrians | 67.6 /100 | #158 | Good 79.7% |
| Immigrants | Cuba | 66.7 /100 | #159 | Good 79.7% |
| Moroccans | 66.7 /100 | #160 | Good 79.7% |
| South Africans | 66.2 /100 | #161 | Good 79.7% |
| Germans | 65.2 /100 | #162 | Good 79.7% |
| Immigrants | Costa Rica | 64.6 /100 | #163 | Good 79.7% |
| Immigrants | Burma/Myanmar | 64.4 /100 | #164 | Good 79.7% |
| Nigerians | 64.0 /100 | #165 | Good 79.7% |
| Okinawans | 62.7 /100 | #166 | Good 79.6% |
| Immigrants | Iraq | 62.0 /100 | #167 | Good 79.6% |
Demographics Similar to Maltese by In Labor Force | Age 20-64
In terms of in labor force | age 20-64, the demographic groups most similar to Maltese are Immigrants from Taiwan (80.0%, a difference of 0.0%), Immigrants from Vietnam (80.0%, a difference of 0.010%), Cape Verdean (80.0%, a difference of 0.010%), Immigrants from Kuwait (80.0%, a difference of 0.010%), and Mongolian (79.9%, a difference of 0.010%).
| Demographics | Rating | Rank | In Labor Force | Age 20-64 |
| Sri Lankans | 93.9 /100 | #113 | Exceptional 80.0% |
| Argentineans | 93.8 /100 | #114 | Exceptional 80.0% |
| Bermudans | 93.3 /100 | #115 | Exceptional 80.0% |
| Immigrants | Western Africa | 93.1 /100 | #116 | Exceptional 80.0% |
| Immigrants | Vietnam | 92.7 /100 | #117 | Exceptional 80.0% |
| Cape Verdeans | 92.7 /100 | #118 | Exceptional 80.0% |
| Immigrants | Taiwan | 92.5 /100 | #119 | Exceptional 80.0% |
| Maltese | 92.4 /100 | #120 | Exceptional 80.0% |
| Immigrants | Kuwait | 92.2 /100 | #121 | Exceptional 80.0% |
| Mongolians | 92.0 /100 | #122 | Exceptional 79.9% |
| Immigrants | Russia | 91.8 /100 | #123 | Exceptional 79.9% |
| Immigrants | Europe | 91.6 /100 | #124 | Exceptional 79.9% |
| Danes | 91.5 /100 | #125 | Exceptional 79.9% |
| Immigrants | France | 90.7 /100 | #126 | Exceptional 79.9% |
| Immigrants | Czechoslovakia | 89.7 /100 | #127 | Excellent 79.9% |