Marshallese vs Pennsylvania German In Labor Force | Age > 16
COMPARE
Marshallese
Pennsylvania German
In Labor Force | Age > 16
In Labor Force | Age > 16 Comparison
Marshallese
Pennsylvania Germans
64.2%
IN LABOR FORCE | AGE > 16
0.7/ 100
METRIC RATING
260th/ 347
METRIC RANK
63.4%
IN LABOR FORCE | AGE > 16
0.0/ 100
METRIC RATING
308th/ 347
METRIC RANK
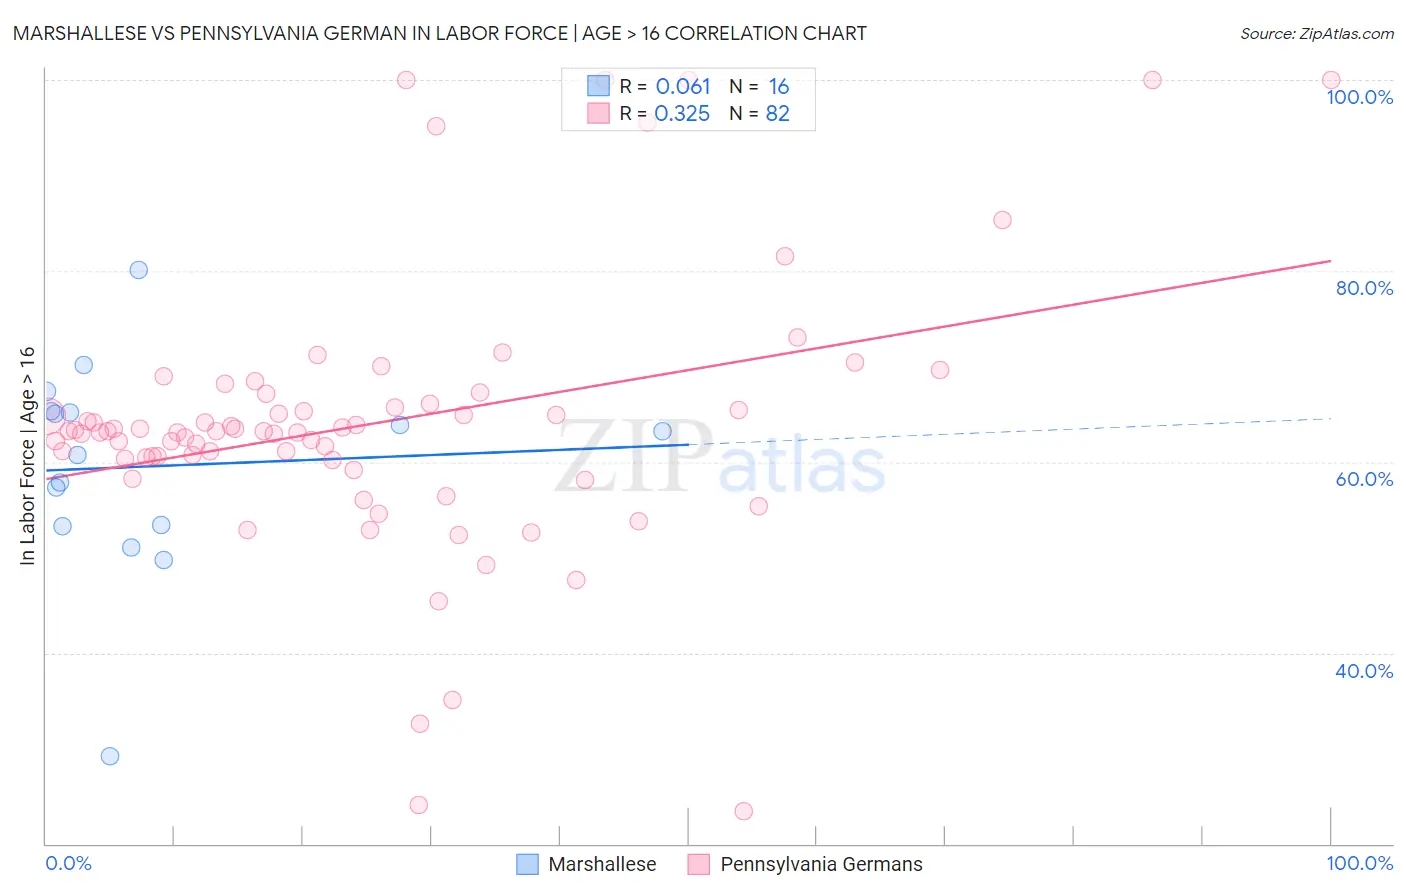
Marshallese vs Pennsylvania German In Labor Force | Age > 16 Correlation Chart
The statistical analysis conducted on geographies consisting of 14,761,315 people shows a slight positive correlation between the proportion of Marshallese and labor force participation rate among population ages 16 and over in the United States with a correlation coefficient (R) of 0.061 and weighted average of 64.2%. Similarly, the statistical analysis conducted on geographies consisting of 234,107,646 people shows a mild positive correlation between the proportion of Pennsylvania Germans and labor force participation rate among population ages 16 and over in the United States with a correlation coefficient (R) of 0.325 and weighted average of 63.4%, a difference of 1.3%.
In Labor Force | Age > 16 Correlation Summary
| Measurement | Marshallese | Pennsylvania German |
| Minimum | 29.2% | 23.4% |
| Maximum | 80.1% | 100.0% |
| Range | 50.9% | 76.6% |
| Mean | 59.5% | 64.0% |
| Median | 62.0% | 63.2% |
| Interquartile 25% (IQ1) | 53.3% | 60.3% |
| Interquartile 75% (IQ3) | 65.2% | 66.1% |
| Interquartile Range (IQR) | 11.9% | 5.8% |
| Standard Deviation (Sample) | 11.2% | 14.3% |
| Standard Deviation (Population) | 10.9% | 14.2% |
Similar Demographics by In Labor Force | Age > 16
Demographics Similar to Marshallese by In Labor Force | Age > 16
In terms of in labor force | age > 16, the demographic groups most similar to Marshallese are Basque (64.2%, a difference of 0.0%), Immigrants from Western Europe (64.2%, a difference of 0.010%), Finnish (64.2%, a difference of 0.010%), Bahamian (64.2%, a difference of 0.030%), and Immigrants from Scotland (64.2%, a difference of 0.040%).
| Demographics | Rating | Rank | In Labor Force | Age > 16 |
| Czechoslovakians | 1.4 /100 | #253 | Tragic 64.3% |
| Immigrants | Uzbekistan | 1.4 /100 | #254 | Tragic 64.3% |
| Hispanics or Latinos | 1.1 /100 | #255 | Tragic 64.3% |
| Immigrants | Mexico | 1.0 /100 | #256 | Tragic 64.3% |
| Inupiat | 0.8 /100 | #257 | Tragic 64.3% |
| Immigrants | Scotland | 0.8 /100 | #258 | Tragic 64.2% |
| Immigrants | Western Europe | 0.7 /100 | #259 | Tragic 64.2% |
| Marshallese | 0.7 /100 | #260 | Tragic 64.2% |
| Basques | 0.7 /100 | #261 | Tragic 64.2% |
| Finns | 0.7 /100 | #262 | Tragic 64.2% |
| Bahamians | 0.6 /100 | #263 | Tragic 64.2% |
| Dutch | 0.6 /100 | #264 | Tragic 64.2% |
| Cubans | 0.5 /100 | #265 | Tragic 64.2% |
| Immigrants | England | 0.5 /100 | #266 | Tragic 64.2% |
| Canadians | 0.5 /100 | #267 | Tragic 64.1% |
Demographics Similar to Pennsylvania Germans by In Labor Force | Age > 16
In terms of in labor force | age > 16, the demographic groups most similar to Pennsylvania Germans are Central American Indian (63.4%, a difference of 0.050%), Black/African American (63.4%, a difference of 0.080%), Scotch-Irish (63.3%, a difference of 0.13%), Osage (63.5%, a difference of 0.18%), and Shoshone (63.2%, a difference of 0.20%).
| Demographics | Rating | Rank | In Labor Force | Age > 16 |
| Spanish Americans | 0.0 /100 | #301 | Tragic 63.6% |
| Delaware | 0.0 /100 | #302 | Tragic 63.6% |
| Cree | 0.0 /100 | #303 | Tragic 63.5% |
| Immigrants | Nonimmigrants | 0.0 /100 | #304 | Tragic 63.5% |
| Osage | 0.0 /100 | #305 | Tragic 63.5% |
| Blacks/African Americans | 0.0 /100 | #306 | Tragic 63.4% |
| Central American Indians | 0.0 /100 | #307 | Tragic 63.4% |
| Pennsylvania Germans | 0.0 /100 | #308 | Tragic 63.4% |
| Scotch-Irish | 0.0 /100 | #309 | Tragic 63.3% |
| Shoshone | 0.0 /100 | #310 | Tragic 63.2% |
| Blackfeet | 0.0 /100 | #311 | Tragic 63.2% |
| Iroquois | 0.0 /100 | #312 | Tragic 63.2% |
| Chippewa | 0.0 /100 | #313 | Tragic 63.1% |
| Yaqui | 0.0 /100 | #314 | Tragic 63.0% |
| Potawatomi | 0.0 /100 | #315 | Tragic 62.8% |