Marshallese vs French American Indian In Labor Force | Age > 16
COMPARE
Marshallese
French American Indian
In Labor Force | Age > 16
In Labor Force | Age > 16 Comparison
Marshallese
French American Indians
64.2%
IN LABOR FORCE | AGE > 16
0.7/ 100
METRIC RATING
260th/ 347
METRIC RANK
64.1%
IN LABOR FORCE | AGE > 16
0.3/ 100
METRIC RATING
276th/ 347
METRIC RANK
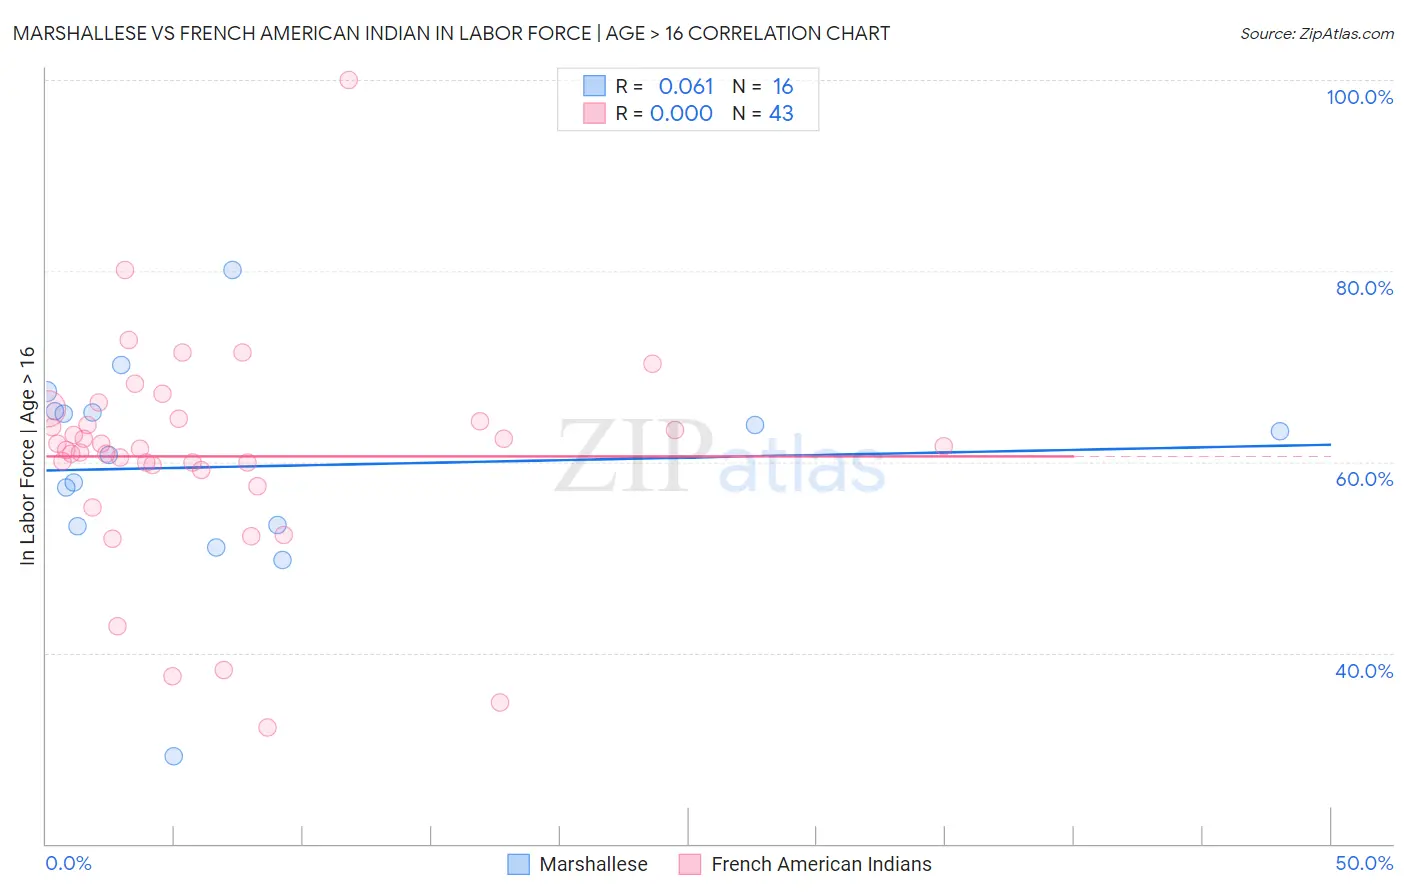
Marshallese vs French American Indian In Labor Force | Age > 16 Correlation Chart
The statistical analysis conducted on geographies consisting of 14,761,315 people shows a slight positive correlation between the proportion of Marshallese and labor force participation rate among population ages 16 and over in the United States with a correlation coefficient (R) of 0.061 and weighted average of 64.2%. Similarly, the statistical analysis conducted on geographies consisting of 131,976,269 people shows no correlation between the proportion of French American Indians and labor force participation rate among population ages 16 and over in the United States with a correlation coefficient (R) of 0.000 and weighted average of 64.1%, a difference of 0.23%.
In Labor Force | Age > 16 Correlation Summary
| Measurement | Marshallese | French American Indian |
| Minimum | 29.2% | 32.2% |
| Maximum | 80.1% | 100.0% |
| Range | 50.9% | 67.8% |
| Mean | 59.5% | 60.6% |
| Median | 62.0% | 61.4% |
| Interquartile 25% (IQ1) | 53.3% | 59.1% |
| Interquartile 75% (IQ3) | 65.2% | 64.5% |
| Interquartile Range (IQR) | 11.9% | 5.3% |
| Standard Deviation (Sample) | 11.2% | 11.7% |
| Standard Deviation (Population) | 10.9% | 11.5% |
Demographics Similar to Marshallese and French American Indians by In Labor Force | Age > 16
In terms of in labor force | age > 16, the demographic groups most similar to Marshallese are Basque (64.2%, a difference of 0.0%), Immigrants from Western Europe (64.2%, a difference of 0.010%), Finnish (64.2%, a difference of 0.010%), Bahamian (64.2%, a difference of 0.030%), and Immigrants from Scotland (64.2%, a difference of 0.040%). Similarly, the demographic groups most similar to French American Indians are Immigrants from Cuba (64.1%, a difference of 0.0%), Mexican (64.1%, a difference of 0.0%), Native Hawaiian (64.1%, a difference of 0.020%), Hmong (64.1%, a difference of 0.020%), and Immigrants from Bahamas (64.0%, a difference of 0.030%).
| Demographics | Rating | Rank | In Labor Force | Age > 16 |
| Immigrants | Scotland | 0.8 /100 | #258 | Tragic 64.2% |
| Immigrants | Western Europe | 0.7 /100 | #259 | Tragic 64.2% |
| Marshallese | 0.7 /100 | #260 | Tragic 64.2% |
| Basques | 0.7 /100 | #261 | Tragic 64.2% |
| Finns | 0.7 /100 | #262 | Tragic 64.2% |
| Bahamians | 0.6 /100 | #263 | Tragic 64.2% |
| Dutch | 0.6 /100 | #264 | Tragic 64.2% |
| Cubans | 0.5 /100 | #265 | Tragic 64.2% |
| Immigrants | England | 0.5 /100 | #266 | Tragic 64.2% |
| Canadians | 0.5 /100 | #267 | Tragic 64.1% |
| Spaniards | 0.5 /100 | #268 | Tragic 64.1% |
| Irish | 0.4 /100 | #269 | Tragic 64.1% |
| Guyanese | 0.4 /100 | #270 | Tragic 64.1% |
| Dominicans | 0.4 /100 | #271 | Tragic 64.1% |
| Native Hawaiians | 0.3 /100 | #272 | Tragic 64.1% |
| Hmong | 0.3 /100 | #273 | Tragic 64.1% |
| Immigrants | Cuba | 0.3 /100 | #274 | Tragic 64.1% |
| Mexicans | 0.3 /100 | #275 | Tragic 64.1% |
| French American Indians | 0.3 /100 | #276 | Tragic 64.1% |
| Immigrants | Bahamas | 0.3 /100 | #277 | Tragic 64.0% |
| Assyrians/Chaldeans/Syriacs | 0.3 /100 | #278 | Tragic 64.0% |