Latvian vs Immigrants from Zaire Unemployment Among Ages 20 to 24 years
COMPARE
Latvian
Immigrants from Zaire
Unemployment Among Ages 20 to 24 years
Unemployment Among Ages 20 to 24 years Comparison
Latvians
Immigrants from Zaire
9.9%
UNEMPLOYMENT AMONG AGES 20 TO 24 YEARS
97.9/ 100
METRIC RATING
84th/ 347
METRIC RANK
9.6%
UNEMPLOYMENT AMONG AGES 20 TO 24 YEARS
100.0/ 100
METRIC RATING
37th/ 347
METRIC RANK
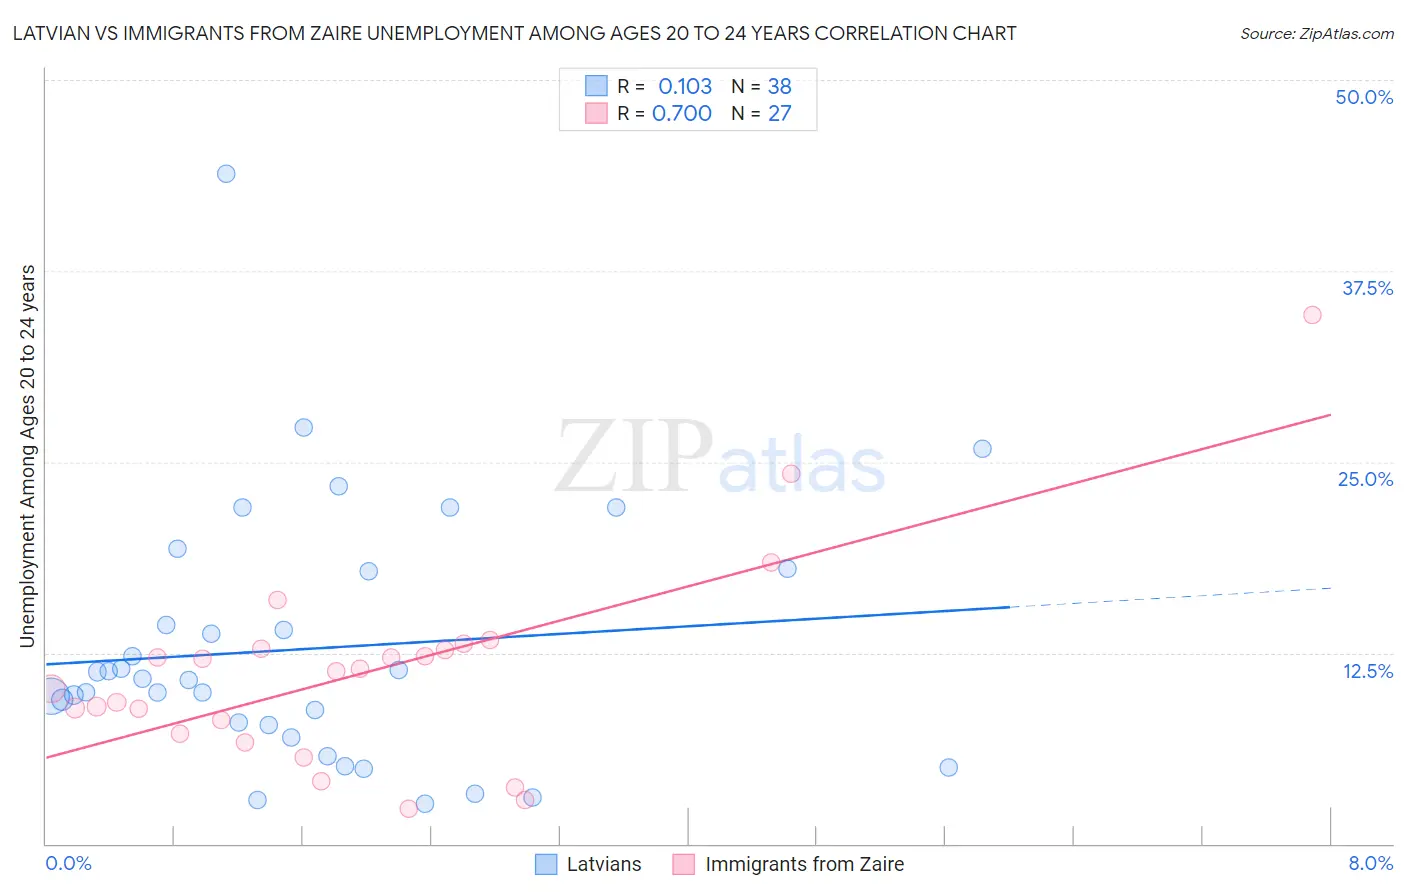
Latvian vs Immigrants from Zaire Unemployment Among Ages 20 to 24 years Correlation Chart
The statistical analysis conducted on geographies consisting of 215,911,655 people shows a poor positive correlation between the proportion of Latvians and unemployment rate among population between the ages 20 and 24 in the United States with a correlation coefficient (R) of 0.103 and weighted average of 9.9%. Similarly, the statistical analysis conducted on geographies consisting of 106,574,951 people shows a significant positive correlation between the proportion of Immigrants from Zaire and unemployment rate among population between the ages 20 and 24 in the United States with a correlation coefficient (R) of 0.700 and weighted average of 9.6%, a difference of 3.7%.
Unemployment Among Ages 20 to 24 years Correlation Summary
| Measurement | Latvian | Immigrants from Zaire |
| Minimum | 2.7% | 2.3% |
| Maximum | 43.9% | 34.6% |
| Range | 41.2% | 32.3% |
| Mean | 12.8% | 11.2% |
| Median | 10.8% | 11.3% |
| Interquartile 25% (IQ1) | 7.8% | 7.2% |
| Interquartile 75% (IQ3) | 17.8% | 12.7% |
| Interquartile Range (IQR) | 10.0% | 5.6% |
| Standard Deviation (Sample) | 8.4% | 6.7% |
| Standard Deviation (Population) | 8.3% | 6.6% |
Similar Demographics by Unemployment Among Ages 20 to 24 years
Demographics Similar to Latvians by Unemployment Among Ages 20 to 24 years
In terms of unemployment among ages 20 to 24 years, the demographic groups most similar to Latvians are Immigrants from Bulgaria (9.9%, a difference of 0.010%), Yaqui (9.9%, a difference of 0.030%), Sri Lankan (9.9%, a difference of 0.030%), New Zealander (9.9%, a difference of 0.050%), and Immigrants from Netherlands (9.9%, a difference of 0.14%).
| Demographics | Rating | Rank | Unemployment Among Ages 20 to 24 years |
| Chickasaw | 98.4 /100 | #77 | Exceptional 9.9% |
| Assyrians/Chaldeans/Syriacs | 98.3 /100 | #78 | Exceptional 9.9% |
| Icelanders | 98.3 /100 | #79 | Exceptional 9.9% |
| Immigrants | Netherlands | 98.2 /100 | #80 | Exceptional 9.9% |
| Yaqui | 98.0 /100 | #81 | Exceptional 9.9% |
| Sri Lankans | 98.0 /100 | #82 | Exceptional 9.9% |
| Immigrants | Bulgaria | 98.0 /100 | #83 | Exceptional 9.9% |
| Latvians | 97.9 /100 | #84 | Exceptional 9.9% |
| New Zealanders | 97.8 /100 | #85 | Exceptional 9.9% |
| Immigrants | Vietnam | 97.5 /100 | #86 | Exceptional 10.0% |
| Immigrants | Oceania | 97.4 /100 | #87 | Exceptional 10.0% |
| Poles | 97.1 /100 | #88 | Exceptional 10.0% |
| Macedonians | 97.0 /100 | #89 | Exceptional 10.0% |
| Chileans | 97.0 /100 | #90 | Exceptional 10.0% |
| Bhutanese | 96.9 /100 | #91 | Exceptional 10.0% |
Demographics Similar to Immigrants from Zaire by Unemployment Among Ages 20 to 24 years
In terms of unemployment among ages 20 to 24 years, the demographic groups most similar to Immigrants from Zaire are Afghan (9.6%, a difference of 0.070%), Belgian (9.6%, a difference of 0.080%), German (9.6%, a difference of 0.11%), Yugoslavian (9.6%, a difference of 0.19%), and Dutch (9.6%, a difference of 0.29%).
| Demographics | Rating | Rank | Unemployment Among Ages 20 to 24 years |
| Scandinavians | 100.0 /100 | #30 | Exceptional 9.5% |
| Immigrants | Eastern Africa | 100.0 /100 | #31 | Exceptional 9.5% |
| Cambodians | 100.0 /100 | #32 | Exceptional 9.5% |
| Australians | 100.0 /100 | #33 | Exceptional 9.6% |
| Yugoslavians | 100.0 /100 | #34 | Exceptional 9.6% |
| Germans | 100.0 /100 | #35 | Exceptional 9.6% |
| Belgians | 100.0 /100 | #36 | Exceptional 9.6% |
| Immigrants | Zaire | 100.0 /100 | #37 | Exceptional 9.6% |
| Afghans | 99.9 /100 | #38 | Exceptional 9.6% |
| Dutch | 99.9 /100 | #39 | Exceptional 9.6% |
| Immigrants | Ethiopia | 99.9 /100 | #40 | Exceptional 9.6% |
| Swiss | 99.9 /100 | #41 | Exceptional 9.7% |
| Immigrants | Saudi Arabia | 99.9 /100 | #42 | Exceptional 9.7% |
| Menominee | 99.8 /100 | #43 | Exceptional 9.7% |
| Europeans | 99.8 /100 | #44 | Exceptional 9.7% |