Kenyan vs German In Labor Force | Age 45-54
COMPARE
Kenyan
German
In Labor Force | Age 45-54
In Labor Force | Age 45-54 Comparison
Kenyans
Germans
83.7%
IN LABOR FORCE | AGE 45-54
99.5/ 100
METRIC RATING
34th/ 347
METRIC RANK
83.1%
IN LABOR FORCE | AGE 45-54
85.1/ 100
METRIC RATING
128th/ 347
METRIC RANK
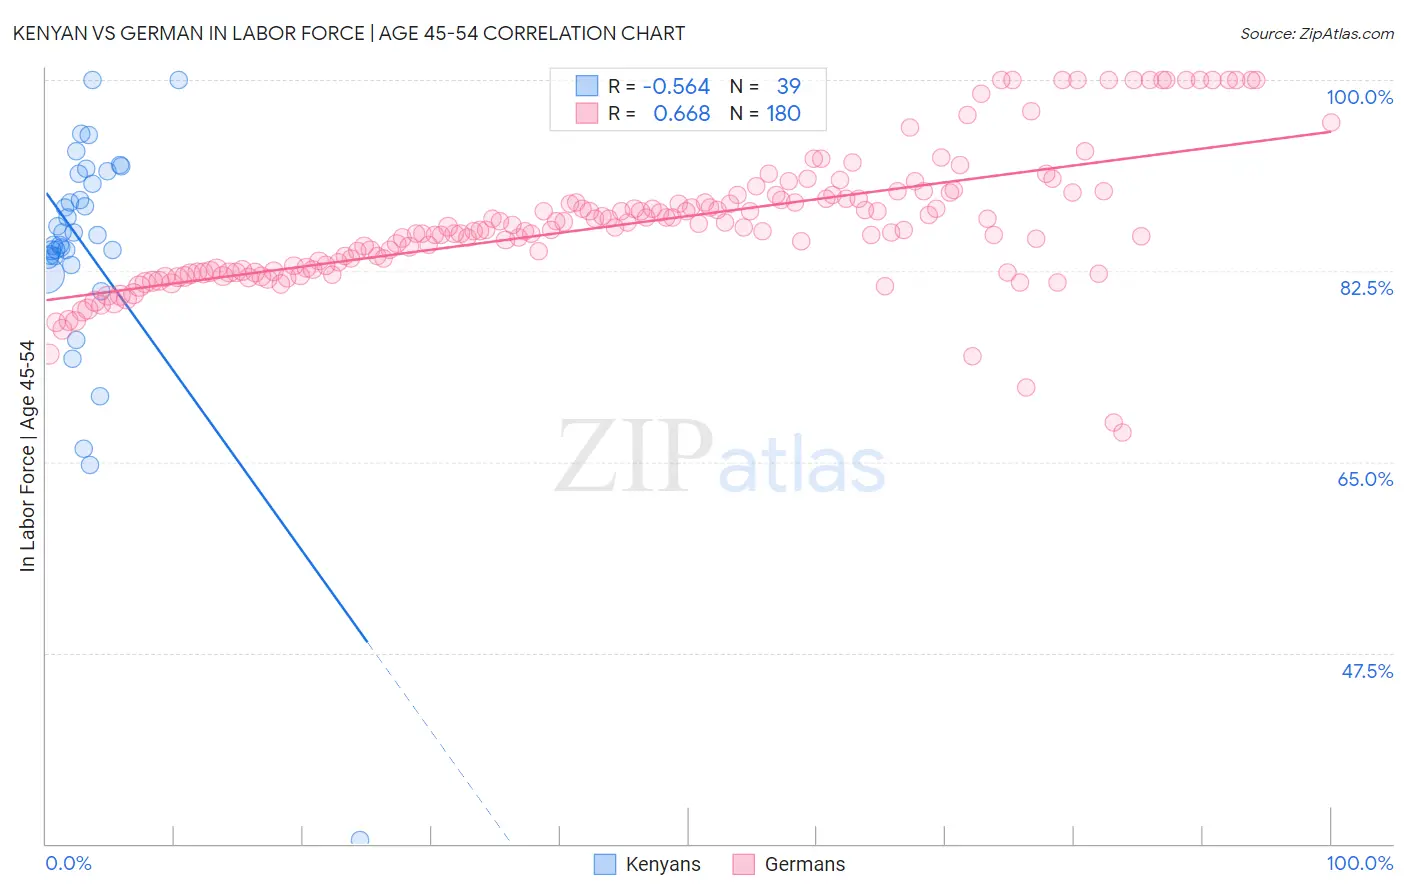
Kenyan vs German In Labor Force | Age 45-54 Correlation Chart
The statistical analysis conducted on geographies consisting of 168,172,450 people shows a substantial negative correlation between the proportion of Kenyans and labor force participation rate among population between the ages 45 and 54 in the United States with a correlation coefficient (R) of -0.564 and weighted average of 83.7%. Similarly, the statistical analysis conducted on geographies consisting of 580,196,129 people shows a significant positive correlation between the proportion of Germans and labor force participation rate among population between the ages 45 and 54 in the United States with a correlation coefficient (R) of 0.668 and weighted average of 83.1%, a difference of 0.77%.
In Labor Force | Age 45-54 Correlation Summary
| Measurement | Kenyan | German |
| Minimum | 30.4% | 67.7% |
| Maximum | 100.0% | 100.0% |
| Range | 69.6% | 32.3% |
| Mean | 84.4% | 86.8% |
| Median | 85.8% | 86.3% |
| Interquartile 25% (IQ1) | 83.7% | 82.4% |
| Interquartile 75% (IQ3) | 91.4% | 89.2% |
| Interquartile Range (IQR) | 7.7% | 6.7% |
| Standard Deviation (Sample) | 11.7% | 6.1% |
| Standard Deviation (Population) | 11.6% | 6.1% |
Similar Demographics by In Labor Force | Age 45-54
Demographics Similar to Kenyans by In Labor Force | Age 45-54
In terms of in labor force | age 45-54, the demographic groups most similar to Kenyans are Brazilian (83.7%, a difference of 0.0%), Ugandan (83.7%, a difference of 0.0%), Swedish (83.7%, a difference of 0.030%), Immigrants from Venezuela (83.7%, a difference of 0.040%), and Immigrants from Cuba (83.7%, a difference of 0.040%).
| Demographics | Rating | Rank | In Labor Force | Age 45-54 |
| Immigrants | Brazil | 99.8 /100 | #27 | Exceptional 83.9% |
| Immigrants | Lithuania | 99.8 /100 | #28 | Exceptional 83.9% |
| Immigrants | Pakistan | 99.7 /100 | #29 | Exceptional 83.8% |
| Immigrants | Bulgaria | 99.7 /100 | #30 | Exceptional 83.8% |
| Immigrants | Eritrea | 99.7 /100 | #31 | Exceptional 83.8% |
| Turks | 99.7 /100 | #32 | Exceptional 83.8% |
| Latvians | 99.7 /100 | #33 | Exceptional 83.8% |
| Kenyans | 99.5 /100 | #34 | Exceptional 83.7% |
| Brazilians | 99.5 /100 | #35 | Exceptional 83.7% |
| Ugandans | 99.5 /100 | #36 | Exceptional 83.7% |
| Swedes | 99.4 /100 | #37 | Exceptional 83.7% |
| Immigrants | Venezuela | 99.4 /100 | #38 | Exceptional 83.7% |
| Immigrants | Cuba | 99.4 /100 | #39 | Exceptional 83.7% |
| Immigrants | Uganda | 99.4 /100 | #40 | Exceptional 83.7% |
| Immigrants | Korea | 99.3 /100 | #41 | Exceptional 83.7% |
Demographics Similar to Germans by In Labor Force | Age 45-54
In terms of in labor force | age 45-54, the demographic groups most similar to Germans are Immigrants from Jordan (83.1%, a difference of 0.0%), Immigrants from Northern Europe (83.1%, a difference of 0.0%), Immigrants from Israel (83.1%, a difference of 0.010%), Immigrants from Belgium (83.1%, a difference of 0.020%), and Finnish (83.1%, a difference of 0.030%).
| Demographics | Rating | Rank | In Labor Force | Age 45-54 |
| Uruguayans | 89.4 /100 | #121 | Excellent 83.1% |
| Immigrants | Vietnam | 88.9 /100 | #122 | Excellent 83.1% |
| Tongans | 88.2 /100 | #123 | Excellent 83.1% |
| Bermudans | 88.0 /100 | #124 | Excellent 83.1% |
| Immigrants | Iran | 87.2 /100 | #125 | Excellent 83.1% |
| Immigrants | Belgium | 86.4 /100 | #126 | Excellent 83.1% |
| Immigrants | Jordan | 85.2 /100 | #127 | Excellent 83.1% |
| Germans | 85.1 /100 | #128 | Excellent 83.1% |
| Immigrants | Northern Europe | 85.1 /100 | #129 | Excellent 83.1% |
| Immigrants | Israel | 84.7 /100 | #130 | Excellent 83.1% |
| Finns | 83.3 /100 | #131 | Excellent 83.1% |
| Immigrants | Ukraine | 82.9 /100 | #132 | Excellent 83.0% |
| Liberians | 82.7 /100 | #133 | Excellent 83.0% |
| Sudanese | 82.0 /100 | #134 | Excellent 83.0% |
| Austrians | 81.3 /100 | #135 | Excellent 83.0% |