Immigrants from South Central Asia vs Spanish In Labor Force | Age > 16
COMPARE
Immigrants from South Central Asia
Spanish
In Labor Force | Age > 16
In Labor Force | Age > 16 Comparison
Immigrants from South Central Asia
Spanish
67.1%
IN LABOR FORCE | AGE > 16
100.0/ 100
METRIC RATING
35th/ 347
METRIC RANK
63.9%
IN LABOR FORCE | AGE > 16
0.1/ 100
METRIC RATING
288th/ 347
METRIC RANK
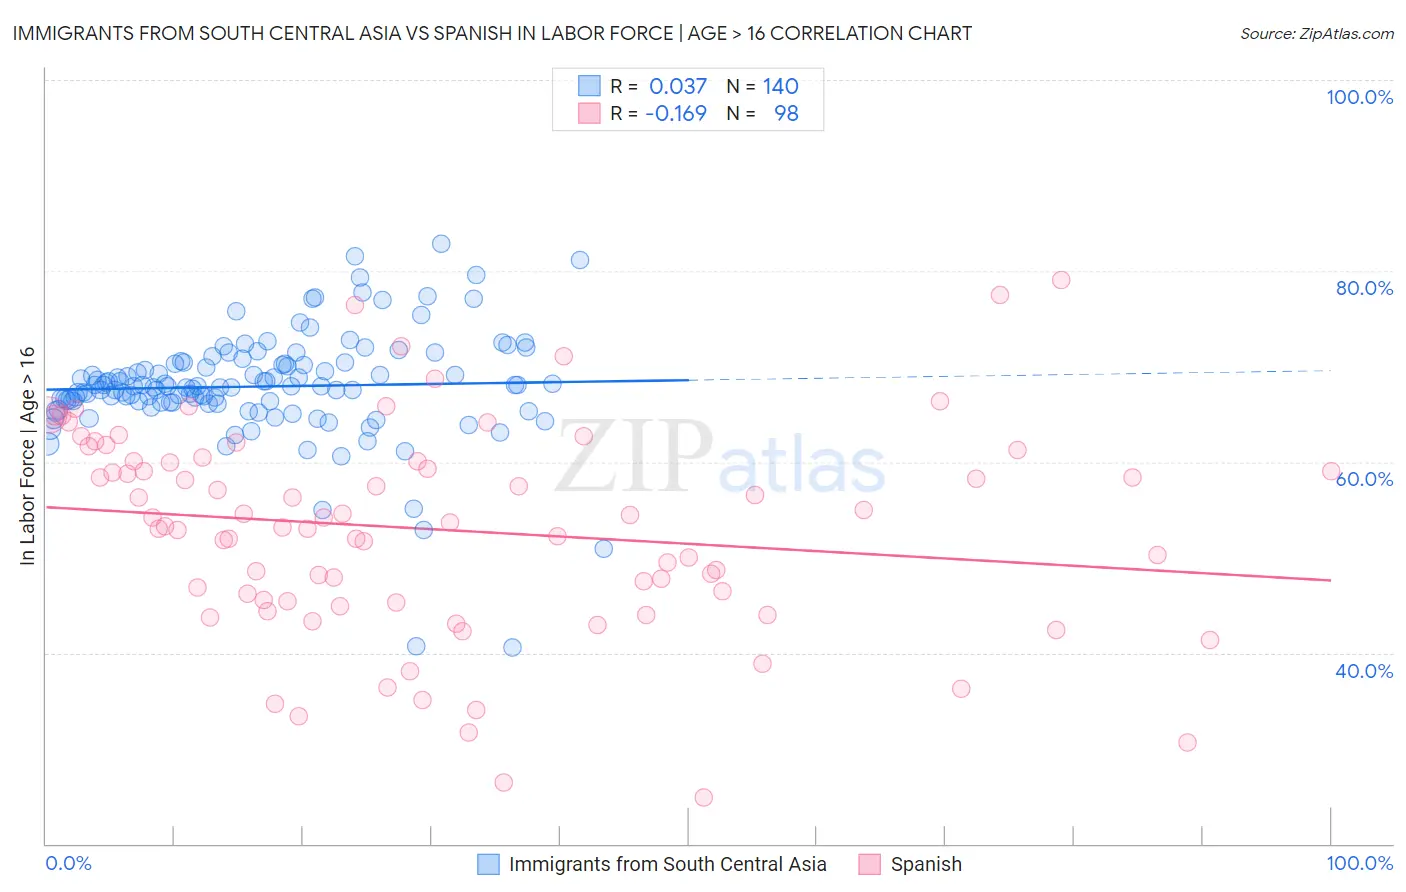
Immigrants from South Central Asia vs Spanish In Labor Force | Age > 16 Correlation Chart
The statistical analysis conducted on geographies consisting of 473,125,366 people shows no correlation between the proportion of Immigrants from South Central Asia and labor force participation rate among population ages 16 and over in the United States with a correlation coefficient (R) of 0.037 and weighted average of 67.1%. Similarly, the statistical analysis conducted on geographies consisting of 422,185,482 people shows a poor negative correlation between the proportion of Spanish and labor force participation rate among population ages 16 and over in the United States with a correlation coefficient (R) of -0.169 and weighted average of 63.9%, a difference of 5.0%.
In Labor Force | Age > 16 Correlation Summary
| Measurement | Immigrants from South Central Asia | Spanish |
| Minimum | 40.5% | 24.8% |
| Maximum | 82.9% | 79.0% |
| Range | 42.4% | 54.2% |
| Mean | 67.9% | 52.9% |
| Median | 67.9% | 53.5% |
| Interquartile 25% (IQ1) | 66.2% | 45.4% |
| Interquartile 75% (IQ3) | 70.2% | 60.1% |
| Interquartile Range (IQR) | 4.0% | 14.7% |
| Standard Deviation (Sample) | 5.9% | 11.0% |
| Standard Deviation (Population) | 5.9% | 11.0% |
Similar Demographics by In Labor Force | Age > 16
Demographics Similar to Immigrants from South Central Asia by In Labor Force | Age > 16
In terms of in labor force | age > 16, the demographic groups most similar to Immigrants from South Central Asia are Immigrants from Western Africa (67.1%, a difference of 0.0%), Immigrants from Ghana (67.1%, a difference of 0.050%), Immigrants from Congo (67.1%, a difference of 0.070%), Afghan (67.1%, a difference of 0.070%), and Immigrants from Afghanistan (67.0%, a difference of 0.080%).
| Demographics | Rating | Rank | In Labor Force | Age > 16 |
| Immigrants | Morocco | 100.0 /100 | #28 | Exceptional 67.2% |
| Thais | 100.0 /100 | #29 | Exceptional 67.2% |
| Immigrants | Zaire | 100.0 /100 | #30 | Exceptional 67.2% |
| Ghanaians | 100.0 /100 | #31 | Exceptional 67.1% |
| Immigrants | Congo | 100.0 /100 | #32 | Exceptional 67.1% |
| Afghans | 100.0 /100 | #33 | Exceptional 67.1% |
| Immigrants | Ghana | 100.0 /100 | #34 | Exceptional 67.1% |
| Immigrants | South Central Asia | 100.0 /100 | #35 | Exceptional 67.1% |
| Immigrants | Western Africa | 100.0 /100 | #36 | Exceptional 67.1% |
| Immigrants | Afghanistan | 100.0 /100 | #37 | Exceptional 67.0% |
| Immigrants | Nigeria | 100.0 /100 | #38 | Exceptional 66.9% |
| Salvadorans | 100.0 /100 | #39 | Exceptional 66.8% |
| Immigrants | El Salvador | 100.0 /100 | #40 | Exceptional 66.8% |
| Immigrants | Zimbabwe | 100.0 /100 | #41 | Exceptional 66.8% |
| Senegalese | 100.0 /100 | #42 | Exceptional 66.7% |
Demographics Similar to Spanish by In Labor Force | Age > 16
In terms of in labor force | age > 16, the demographic groups most similar to Spanish are Celtic (63.8%, a difference of 0.030%), Immigrants from Austria (63.9%, a difference of 0.050%), Scottish (63.9%, a difference of 0.050%), Hungarian (63.8%, a difference of 0.060%), and Slovak (63.9%, a difference of 0.070%).
| Demographics | Rating | Rank | In Labor Force | Age > 16 |
| French Canadians | 0.2 /100 | #281 | Tragic 64.0% |
| Immigrants | Guyana | 0.2 /100 | #282 | Tragic 64.0% |
| Immigrants | Germany | 0.1 /100 | #283 | Tragic 63.9% |
| French | 0.1 /100 | #284 | Tragic 63.9% |
| Slovaks | 0.1 /100 | #285 | Tragic 63.9% |
| Immigrants | Austria | 0.1 /100 | #286 | Tragic 63.9% |
| Scottish | 0.1 /100 | #287 | Tragic 63.9% |
| Spanish | 0.1 /100 | #288 | Tragic 63.9% |
| Celtics | 0.1 /100 | #289 | Tragic 63.8% |
| Hungarians | 0.1 /100 | #290 | Tragic 63.8% |
| Nepalese | 0.1 /100 | #291 | Tragic 63.8% |
| Spanish American Indians | 0.1 /100 | #292 | Tragic 63.8% |
| English | 0.1 /100 | #293 | Tragic 63.7% |
| Puget Sound Salish | 0.0 /100 | #294 | Tragic 63.7% |
| Immigrants | Canada | 0.0 /100 | #295 | Tragic 63.7% |