Guatemalan vs Immigrants from Eastern Asia In Labor Force | Age 20-64
COMPARE
Guatemalan
Immigrants from Eastern Asia
In Labor Force | Age 20-64
In Labor Force | Age 20-64 Comparison
Guatemalans
Immigrants from Eastern Asia
78.7%
IN LABOR FORCE | AGE 20-64
0.4/ 100
METRIC RATING
257th/ 347
METRIC RANK
79.9%
IN LABOR FORCE | AGE 20-64
89.4/ 100
METRIC RATING
128th/ 347
METRIC RANK
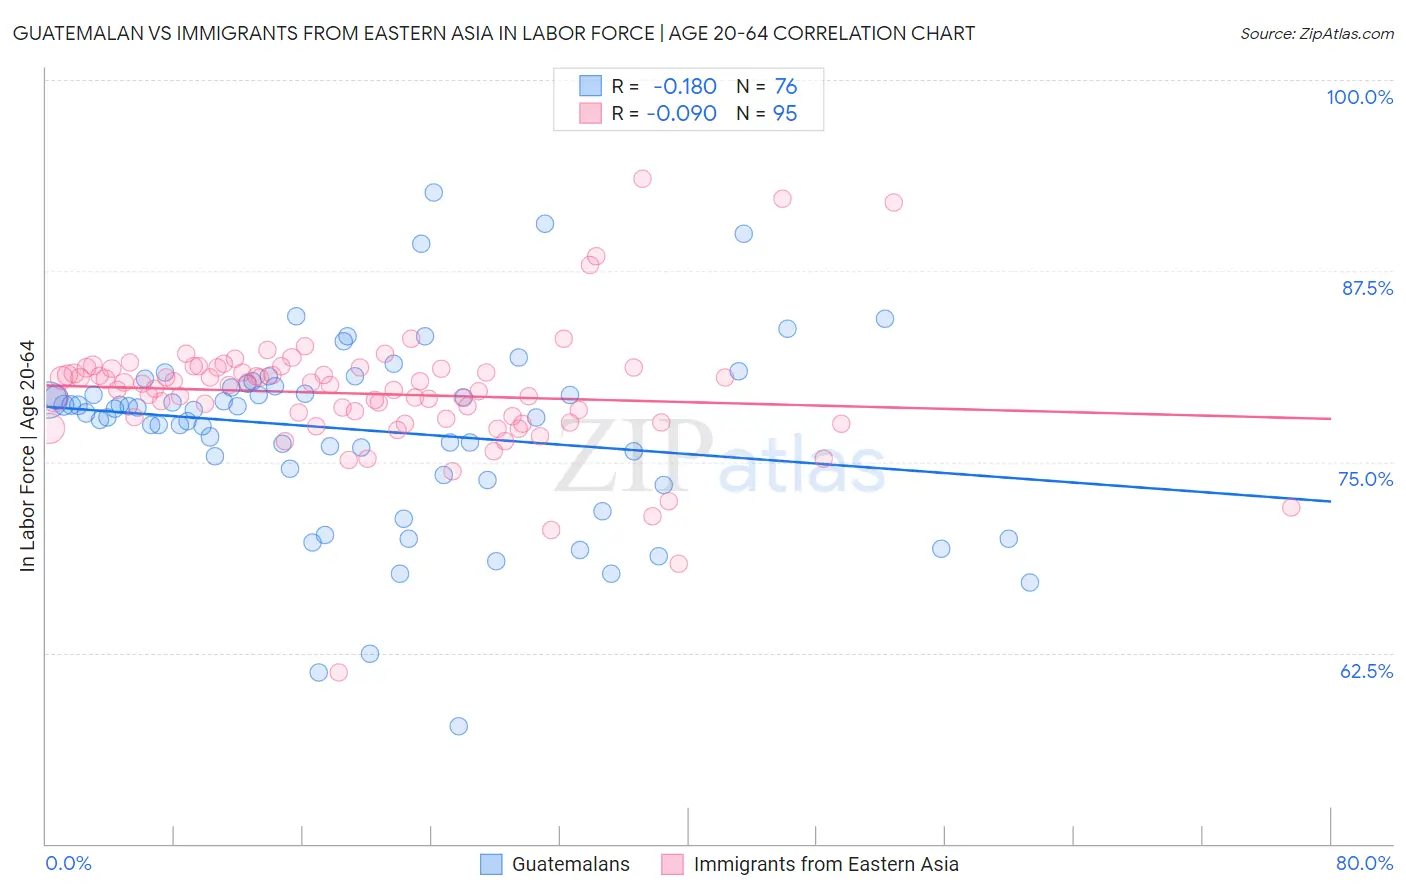
Guatemalan vs Immigrants from Eastern Asia In Labor Force | Age 20-64 Correlation Chart
The statistical analysis conducted on geographies consisting of 409,569,156 people shows a poor negative correlation between the proportion of Guatemalans and labor force participation rate among population between the ages 20 and 64 in the United States with a correlation coefficient (R) of -0.180 and weighted average of 78.7%. Similarly, the statistical analysis conducted on geographies consisting of 499,970,956 people shows a slight negative correlation between the proportion of Immigrants from Eastern Asia and labor force participation rate among population between the ages 20 and 64 in the United States with a correlation coefficient (R) of -0.090 and weighted average of 79.9%, a difference of 1.5%.
In Labor Force | Age 20-64 Correlation Summary
| Measurement | Guatemalan | Immigrants from Eastern Asia |
| Minimum | 57.7% | 61.2% |
| Maximum | 92.6% | 93.5% |
| Range | 34.9% | 32.3% |
| Mean | 77.1% | 79.5% |
| Median | 78.4% | 80.0% |
| Interquartile 25% (IQ1) | 74.4% | 77.6% |
| Interquartile 75% (IQ3) | 80.0% | 81.1% |
| Interquartile Range (IQR) | 5.7% | 3.5% |
| Standard Deviation (Sample) | 6.2% | 4.2% |
| Standard Deviation (Population) | 6.2% | 4.2% |
Similar Demographics by In Labor Force | Age 20-64
Demographics Similar to Guatemalans by In Labor Force | Age 20-64
In terms of in labor force | age 20-64, the demographic groups most similar to Guatemalans are Immigrants from Guatemala (78.7%, a difference of 0.0%), Hawaiian (78.7%, a difference of 0.020%), Celtic (78.7%, a difference of 0.020%), Basque (78.7%, a difference of 0.040%), and Immigrants from Lebanon (78.7%, a difference of 0.040%).
| Demographics | Rating | Rank | In Labor Force | Age 20-64 |
| Hondurans | 0.8 /100 | #250 | Tragic 78.8% |
| Barbadians | 0.7 /100 | #251 | Tragic 78.8% |
| Immigrants | Honduras | 0.6 /100 | #252 | Tragic 78.7% |
| Basques | 0.5 /100 | #253 | Tragic 78.7% |
| Immigrants | Lebanon | 0.5 /100 | #254 | Tragic 78.7% |
| Hawaiians | 0.5 /100 | #255 | Tragic 78.7% |
| Celtics | 0.5 /100 | #256 | Tragic 78.7% |
| Guatemalans | 0.4 /100 | #257 | Tragic 78.7% |
| Immigrants | Guatemala | 0.4 /100 | #258 | Tragic 78.7% |
| Tsimshian | 0.4 /100 | #259 | Tragic 78.7% |
| Immigrants | Fiji | 0.3 /100 | #260 | Tragic 78.6% |
| Whites/Caucasians | 0.2 /100 | #261 | Tragic 78.5% |
| Fijians | 0.1 /100 | #262 | Tragic 78.4% |
| Pennsylvania Germans | 0.1 /100 | #263 | Tragic 78.4% |
| Spaniards | 0.1 /100 | #264 | Tragic 78.4% |
Demographics Similar to Immigrants from Eastern Asia by In Labor Force | Age 20-64
In terms of in labor force | age 20-64, the demographic groups most similar to Immigrants from Eastern Asia are Immigrants from Czechoslovakia (79.9%, a difference of 0.010%), Italian (79.9%, a difference of 0.010%), Immigrants from Zaire (79.9%, a difference of 0.020%), Immigrants from Iran (79.9%, a difference of 0.020%), and Immigrants from France (79.9%, a difference of 0.030%).
| Demographics | Rating | Rank | In Labor Force | Age 20-64 |
| Immigrants | Kuwait | 92.2 /100 | #121 | Exceptional 80.0% |
| Mongolians | 92.0 /100 | #122 | Exceptional 79.9% |
| Immigrants | Russia | 91.8 /100 | #123 | Exceptional 79.9% |
| Immigrants | Europe | 91.6 /100 | #124 | Exceptional 79.9% |
| Danes | 91.5 /100 | #125 | Exceptional 79.9% |
| Immigrants | France | 90.7 /100 | #126 | Exceptional 79.9% |
| Immigrants | Czechoslovakia | 89.7 /100 | #127 | Excellent 79.9% |
| Immigrants | Eastern Asia | 89.4 /100 | #128 | Excellent 79.9% |
| Italians | 88.9 /100 | #129 | Excellent 79.9% |
| Immigrants | Zaire | 88.6 /100 | #130 | Excellent 79.9% |
| Immigrants | Iran | 88.3 /100 | #131 | Excellent 79.9% |
| Indians (Asian) | 87.7 /100 | #132 | Excellent 79.9% |
| South American Indians | 87.6 /100 | #133 | Excellent 79.9% |
| Belgians | 87.4 /100 | #134 | Excellent 79.9% |
| Ukrainians | 86.8 /100 | #135 | Excellent 79.9% |