Inupiat vs Danish In Labor Force | Age 45-54
COMPARE
Inupiat
Danish
In Labor Force | Age 45-54
In Labor Force | Age 45-54 Comparison
Inupiat
Danes
79.9%
IN LABOR FORCE | AGE 45-54
0.0/ 100
METRIC RATING
310th/ 347
METRIC RANK
83.3%
IN LABOR FORCE | AGE 45-54
95.3/ 100
METRIC RATING
92nd/ 347
METRIC RANK
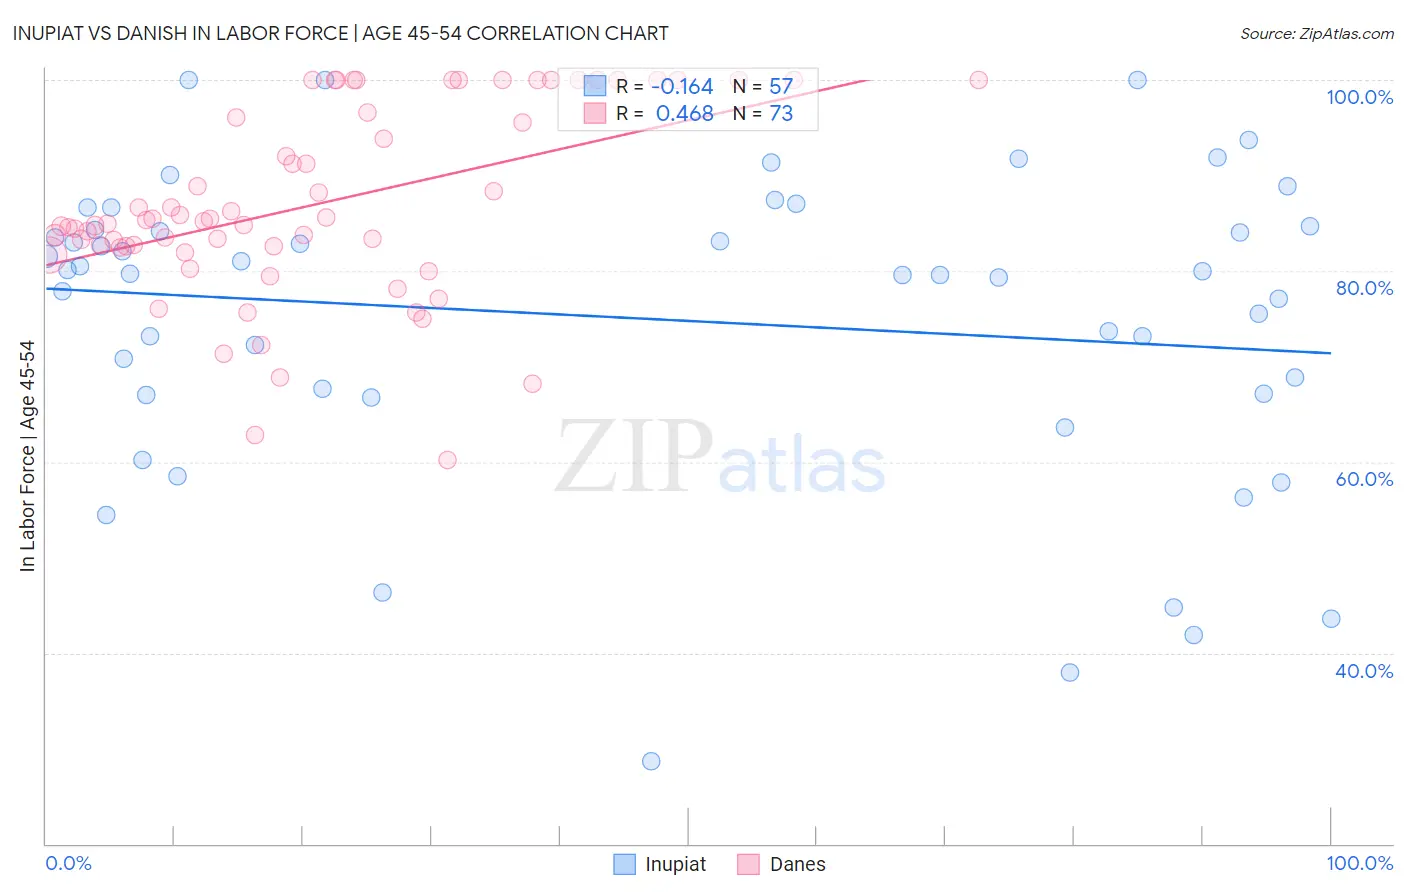
Inupiat vs Danish In Labor Force | Age 45-54 Correlation Chart
The statistical analysis conducted on geographies consisting of 96,331,160 people shows a poor negative correlation between the proportion of Inupiat and labor force participation rate among population between the ages 45 and 54 in the United States with a correlation coefficient (R) of -0.164 and weighted average of 79.9%. Similarly, the statistical analysis conducted on geographies consisting of 473,839,684 people shows a moderate positive correlation between the proportion of Danes and labor force participation rate among population between the ages 45 and 54 in the United States with a correlation coefficient (R) of 0.468 and weighted average of 83.3%, a difference of 4.3%.
In Labor Force | Age 45-54 Correlation Summary
| Measurement | Inupiat | Danish |
| Minimum | 28.6% | 60.2% |
| Maximum | 100.0% | 100.0% |
| Range | 71.4% | 39.8% |
| Mean | 75.0% | 87.0% |
| Median | 79.8% | 85.2% |
| Interquartile 25% (IQ1) | 67.1% | 82.5% |
| Interquartile 75% (IQ3) | 84.5% | 98.3% |
| Interquartile Range (IQR) | 17.4% | 15.8% |
| Standard Deviation (Sample) | 16.0% | 9.9% |
| Standard Deviation (Population) | 15.9% | 9.8% |
Similar Demographics by In Labor Force | Age 45-54
Demographics Similar to Inupiat by In Labor Force | Age 45-54
In terms of in labor force | age 45-54, the demographic groups most similar to Inupiat are Potawatomi (80.0%, a difference of 0.090%), Mexican (79.8%, a difference of 0.11%), Central American Indian (80.0%, a difference of 0.12%), Blackfeet (80.0%, a difference of 0.16%), and Spanish American (80.1%, a difference of 0.24%).
| Demographics | Rating | Rank | In Labor Force | Age 45-54 |
| Immigrants | Azores | 0.0 /100 | #303 | Tragic 80.1% |
| Hispanics or Latinos | 0.0 /100 | #304 | Tragic 80.1% |
| Immigrants | Dominican Republic | 0.0 /100 | #305 | Tragic 80.1% |
| Spanish Americans | 0.0 /100 | #306 | Tragic 80.1% |
| Blackfeet | 0.0 /100 | #307 | Tragic 80.0% |
| Central American Indians | 0.0 /100 | #308 | Tragic 80.0% |
| Potawatomi | 0.0 /100 | #309 | Tragic 80.0% |
| Inupiat | 0.0 /100 | #310 | Tragic 79.9% |
| Mexicans | 0.0 /100 | #311 | Tragic 79.8% |
| Immigrants | Mexico | 0.0 /100 | #312 | Tragic 79.7% |
| Colville | 0.0 /100 | #313 | Tragic 79.5% |
| Ottawa | 0.0 /100 | #314 | Tragic 79.5% |
| Blacks/African Americans | 0.0 /100 | #315 | Tragic 79.3% |
| Shoshone | 0.0 /100 | #316 | Tragic 79.3% |
| Comanche | 0.0 /100 | #317 | Tragic 79.2% |
Demographics Similar to Danes by In Labor Force | Age 45-54
In terms of in labor force | age 45-54, the demographic groups most similar to Danes are Indian (Asian) (83.3%, a difference of 0.010%), Immigrants from Japan (83.3%, a difference of 0.010%), South American (83.3%, a difference of 0.010%), Italian (83.3%, a difference of 0.010%), and Immigrants from Northern Africa (83.3%, a difference of 0.020%).
| Demographics | Rating | Rank | In Labor Force | Age 45-54 |
| Greeks | 95.9 /100 | #85 | Exceptional 83.3% |
| Immigrants | Northern Africa | 95.7 /100 | #86 | Exceptional 83.3% |
| Immigrants | Eastern Europe | 95.6 /100 | #87 | Exceptional 83.3% |
| Immigrants | Asia | 95.6 /100 | #88 | Exceptional 83.3% |
| Indians (Asian) | 95.5 /100 | #89 | Exceptional 83.3% |
| Immigrants | Japan | 95.5 /100 | #90 | Exceptional 83.3% |
| South Americans | 95.5 /100 | #91 | Exceptional 83.3% |
| Danes | 95.3 /100 | #92 | Exceptional 83.3% |
| Italians | 95.1 /100 | #93 | Exceptional 83.3% |
| Argentineans | 94.9 /100 | #94 | Exceptional 83.3% |
| Immigrants | Argentina | 94.9 /100 | #95 | Exceptional 83.3% |
| Immigrants | Kuwait | 94.8 /100 | #96 | Exceptional 83.3% |
| Palestinians | 94.8 /100 | #97 | Exceptional 83.3% |
| Maltese | 94.4 /100 | #98 | Exceptional 83.3% |
| Immigrants | Middle Africa | 94.3 /100 | #99 | Exceptional 83.3% |