Inupiat vs Guyanese In Labor Force | Age 45-54
COMPARE
Inupiat
Guyanese
In Labor Force | Age 45-54
In Labor Force | Age 45-54 Comparison
Inupiat
Guyanese
79.9%
IN LABOR FORCE | AGE 45-54
0.0/ 100
METRIC RATING
310th/ 347
METRIC RANK
81.5%
IN LABOR FORCE | AGE 45-54
0.1/ 100
METRIC RATING
259th/ 347
METRIC RANK
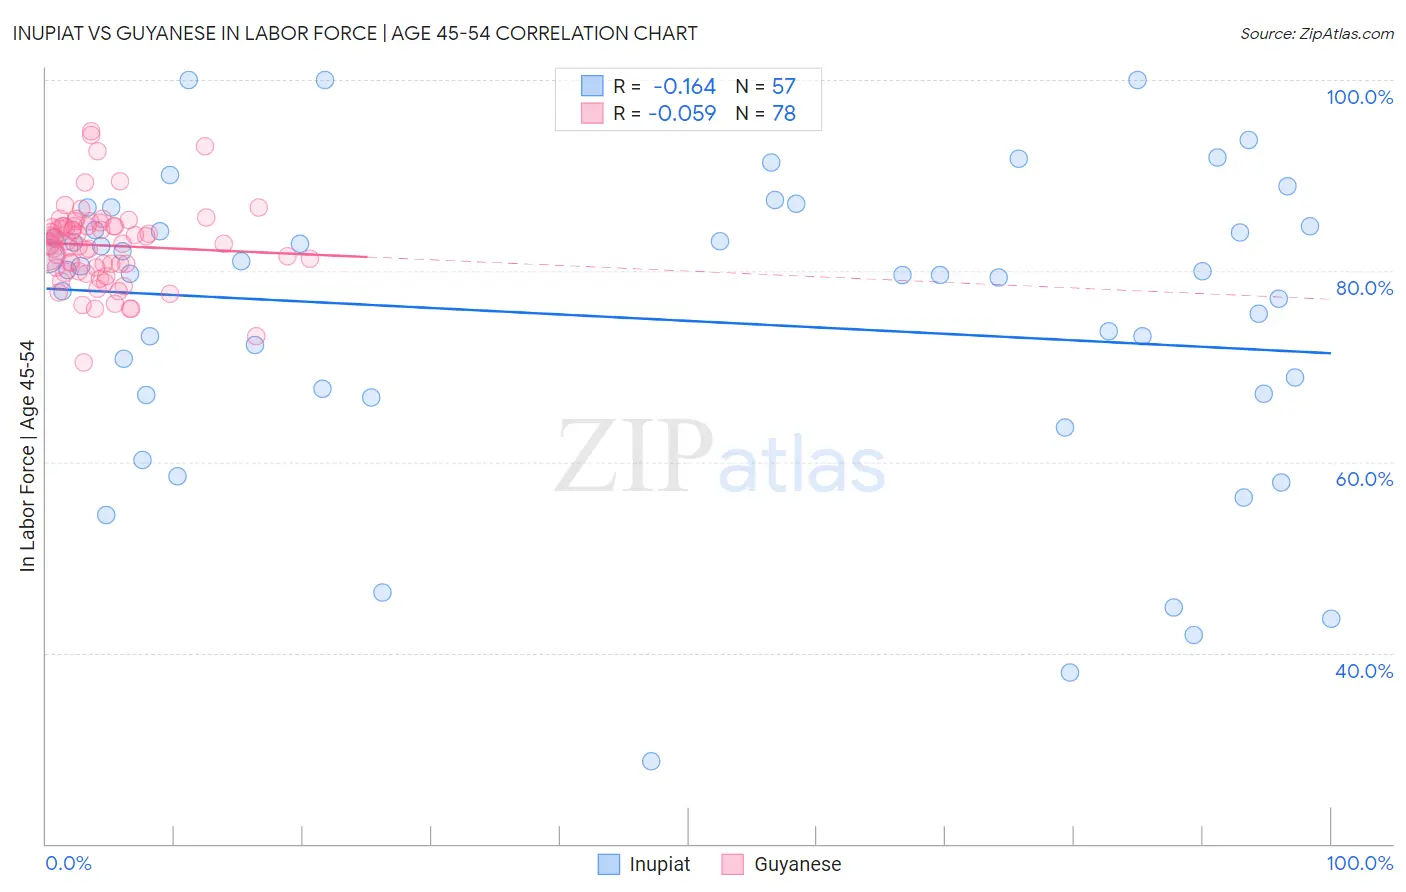
Inupiat vs Guyanese In Labor Force | Age 45-54 Correlation Chart
The statistical analysis conducted on geographies consisting of 96,331,160 people shows a poor negative correlation between the proportion of Inupiat and labor force participation rate among population between the ages 45 and 54 in the United States with a correlation coefficient (R) of -0.164 and weighted average of 79.9%. Similarly, the statistical analysis conducted on geographies consisting of 176,787,593 people shows a slight negative correlation between the proportion of Guyanese and labor force participation rate among population between the ages 45 and 54 in the United States with a correlation coefficient (R) of -0.059 and weighted average of 81.5%, a difference of 2.1%.
In Labor Force | Age 45-54 Correlation Summary
| Measurement | Inupiat | Guyanese |
| Minimum | 28.6% | 70.4% |
| Maximum | 100.0% | 94.6% |
| Range | 71.4% | 24.3% |
| Mean | 75.0% | 82.7% |
| Median | 79.8% | 82.8% |
| Interquartile 25% (IQ1) | 67.1% | 80.4% |
| Interquartile 75% (IQ3) | 84.5% | 84.7% |
| Interquartile Range (IQR) | 17.4% | 4.3% |
| Standard Deviation (Sample) | 16.0% | 4.3% |
| Standard Deviation (Population) | 15.9% | 4.2% |
Similar Demographics by In Labor Force | Age 45-54
Demographics Similar to Inupiat by In Labor Force | Age 45-54
In terms of in labor force | age 45-54, the demographic groups most similar to Inupiat are Potawatomi (80.0%, a difference of 0.090%), Mexican (79.8%, a difference of 0.11%), Central American Indian (80.0%, a difference of 0.12%), Blackfeet (80.0%, a difference of 0.16%), and Spanish American (80.1%, a difference of 0.24%).
| Demographics | Rating | Rank | In Labor Force | Age 45-54 |
| Immigrants | Azores | 0.0 /100 | #303 | Tragic 80.1% |
| Hispanics or Latinos | 0.0 /100 | #304 | Tragic 80.1% |
| Immigrants | Dominican Republic | 0.0 /100 | #305 | Tragic 80.1% |
| Spanish Americans | 0.0 /100 | #306 | Tragic 80.1% |
| Blackfeet | 0.0 /100 | #307 | Tragic 80.0% |
| Central American Indians | 0.0 /100 | #308 | Tragic 80.0% |
| Potawatomi | 0.0 /100 | #309 | Tragic 80.0% |
| Inupiat | 0.0 /100 | #310 | Tragic 79.9% |
| Mexicans | 0.0 /100 | #311 | Tragic 79.8% |
| Immigrants | Mexico | 0.0 /100 | #312 | Tragic 79.7% |
| Colville | 0.0 /100 | #313 | Tragic 79.5% |
| Ottawa | 0.0 /100 | #314 | Tragic 79.5% |
| Blacks/African Americans | 0.0 /100 | #315 | Tragic 79.3% |
| Shoshone | 0.0 /100 | #316 | Tragic 79.3% |
| Comanche | 0.0 /100 | #317 | Tragic 79.2% |
Demographics Similar to Guyanese by In Labor Force | Age 45-54
In terms of in labor force | age 45-54, the demographic groups most similar to Guyanese are Immigrants from Fiji (81.5%, a difference of 0.010%), Immigrants from Congo (81.6%, a difference of 0.020%), Spaniard (81.5%, a difference of 0.030%), Barbadian (81.6%, a difference of 0.040%), and Hawaiian (81.5%, a difference of 0.040%).
| Demographics | Rating | Rank | In Labor Force | Age 45-54 |
| Pennsylvania Germans | 0.2 /100 | #252 | Tragic 81.6% |
| Japanese | 0.2 /100 | #253 | Tragic 81.6% |
| Immigrants | Laos | 0.2 /100 | #254 | Tragic 81.6% |
| Scotch-Irish | 0.2 /100 | #255 | Tragic 81.6% |
| Barbadians | 0.1 /100 | #256 | Tragic 81.6% |
| Immigrants | Congo | 0.1 /100 | #257 | Tragic 81.6% |
| Immigrants | Fiji | 0.1 /100 | #258 | Tragic 81.5% |
| Guyanese | 0.1 /100 | #259 | Tragic 81.5% |
| Spaniards | 0.1 /100 | #260 | Tragic 81.5% |
| Hawaiians | 0.1 /100 | #261 | Tragic 81.5% |
| Immigrants | Guyana | 0.1 /100 | #262 | Tragic 81.5% |
| Indonesians | 0.1 /100 | #263 | Tragic 81.5% |
| Immigrants | West Indies | 0.1 /100 | #264 | Tragic 81.5% |
| Hondurans | 0.1 /100 | #265 | Tragic 81.4% |
| Immigrants | St. Vincent and the Grenadines | 0.1 /100 | #266 | Tragic 81.4% |