Immigrants from Ukraine vs African In Labor Force | Age 20-64
COMPARE
Immigrants from Ukraine
African
In Labor Force | Age 20-64
In Labor Force | Age 20-64 Comparison
Immigrants from Ukraine
Africans
79.9%
IN LABOR FORCE | AGE 20-64
86.5/ 100
METRIC RATING
137th/ 347
METRIC RANK
77.9%
IN LABOR FORCE | AGE 20-64
0.0/ 100
METRIC RATING
289th/ 347
METRIC RANK
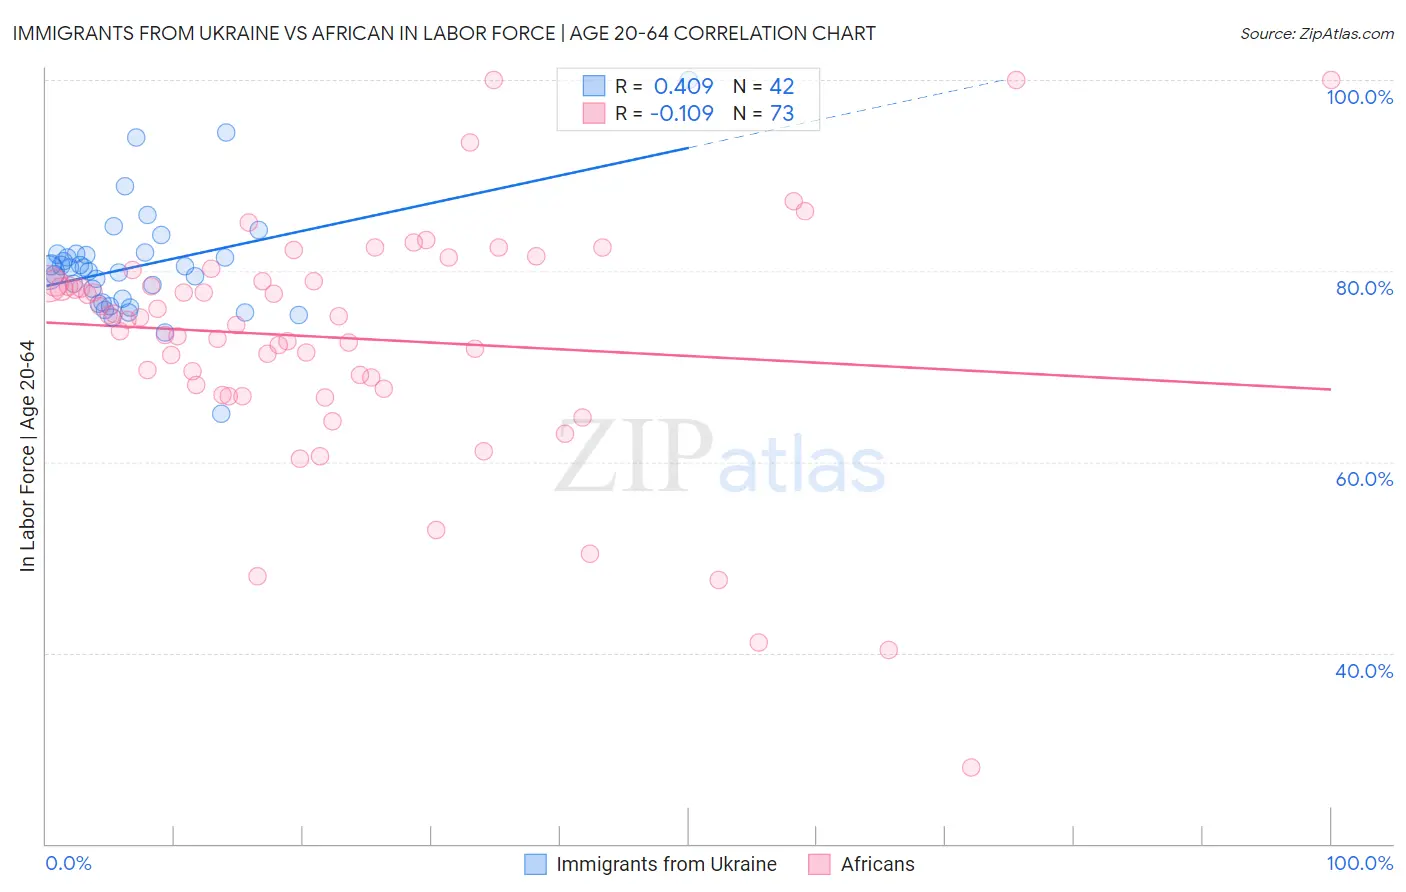
Immigrants from Ukraine vs African In Labor Force | Age 20-64 Correlation Chart
The statistical analysis conducted on geographies consisting of 289,706,757 people shows a moderate positive correlation between the proportion of Immigrants from Ukraine and labor force participation rate among population between the ages 20 and 64 in the United States with a correlation coefficient (R) of 0.409 and weighted average of 79.9%. Similarly, the statistical analysis conducted on geographies consisting of 470,088,010 people shows a poor negative correlation between the proportion of Africans and labor force participation rate among population between the ages 20 and 64 in the United States with a correlation coefficient (R) of -0.109 and weighted average of 77.9%, a difference of 2.5%.
In Labor Force | Age 20-64 Correlation Summary
| Measurement | Immigrants from Ukraine | African |
| Minimum | 65.1% | 28.0% |
| Maximum | 100.0% | 100.0% |
| Range | 34.9% | 72.0% |
| Mean | 80.5% | 73.0% |
| Median | 80.1% | 75.1% |
| Interquartile 25% (IQ1) | 76.6% | 67.9% |
| Interquartile 75% (IQ3) | 81.8% | 79.0% |
| Interquartile Range (IQR) | 5.1% | 11.1% |
| Standard Deviation (Sample) | 5.9% | 12.7% |
| Standard Deviation (Population) | 5.8% | 12.6% |
Similar Demographics by In Labor Force | Age 20-64
Demographics Similar to Immigrants from Ukraine by In Labor Force | Age 20-64
In terms of in labor force | age 20-64, the demographic groups most similar to Immigrants from Ukraine are Immigrants from Singapore (79.9%, a difference of 0.0%), Immigrants from Nigeria (79.9%, a difference of 0.0%), Ukrainian (79.9%, a difference of 0.010%), Indian (Asian) (79.9%, a difference of 0.020%), and South American Indian (79.9%, a difference of 0.020%).
| Demographics | Rating | Rank | In Labor Force | Age 20-64 |
| Immigrants | Zaire | 88.6 /100 | #130 | Excellent 79.9% |
| Immigrants | Iran | 88.3 /100 | #131 | Excellent 79.9% |
| Indians (Asian) | 87.7 /100 | #132 | Excellent 79.9% |
| South American Indians | 87.6 /100 | #133 | Excellent 79.9% |
| Belgians | 87.4 /100 | #134 | Excellent 79.9% |
| Ukrainians | 86.8 /100 | #135 | Excellent 79.9% |
| Immigrants | Singapore | 86.7 /100 | #136 | Excellent 79.9% |
| Immigrants | Ukraine | 86.5 /100 | #137 | Excellent 79.9% |
| Immigrants | Nigeria | 86.4 /100 | #138 | Excellent 79.9% |
| Immigrants | Spain | 83.9 /100 | #139 | Excellent 79.8% |
| Immigrants | South Eastern Asia | 80.4 /100 | #140 | Excellent 79.8% |
| Immigrants | Israel | 80.0 /100 | #141 | Good 79.8% |
| Slovaks | 79.9 /100 | #142 | Good 79.8% |
| Immigrants | Sweden | 79.7 /100 | #143 | Good 79.8% |
| Koreans | 79.6 /100 | #144 | Good 79.8% |
Demographics Similar to Africans by In Labor Force | Age 20-64
In terms of in labor force | age 20-64, the demographic groups most similar to Africans are Hmong (77.9%, a difference of 0.010%), Immigrants from Bangladesh (77.9%, a difference of 0.010%), Spanish American (77.8%, a difference of 0.070%), Vietnamese (78.0%, a difference of 0.080%), and Immigrants from Belize (78.0%, a difference of 0.090%).
| Demographics | Rating | Rank | In Labor Force | Age 20-64 |
| Immigrants | St. Vincent and the Grenadines | 0.0 /100 | #282 | Tragic 78.1% |
| Immigrants | Nonimmigrants | 0.0 /100 | #283 | Tragic 78.1% |
| Immigrants | Guyana | 0.0 /100 | #284 | Tragic 78.1% |
| Osage | 0.0 /100 | #285 | Tragic 78.0% |
| Immigrants | Belize | 0.0 /100 | #286 | Tragic 78.0% |
| Vietnamese | 0.0 /100 | #287 | Tragic 78.0% |
| Hmong | 0.0 /100 | #288 | Tragic 77.9% |
| Africans | 0.0 /100 | #289 | Tragic 77.9% |
| Immigrants | Bangladesh | 0.0 /100 | #290 | Tragic 77.9% |
| Spanish Americans | 0.0 /100 | #291 | Tragic 77.8% |
| Immigrants | Azores | 0.0 /100 | #292 | Tragic 77.8% |
| Delaware | 0.0 /100 | #293 | Tragic 77.8% |
| Immigrants | Central America | 0.0 /100 | #294 | Tragic 77.7% |
| Immigrants | Grenada | 0.0 /100 | #295 | Tragic 77.7% |
| Immigrants | Dominican Republic | 0.0 /100 | #296 | Tragic 77.7% |