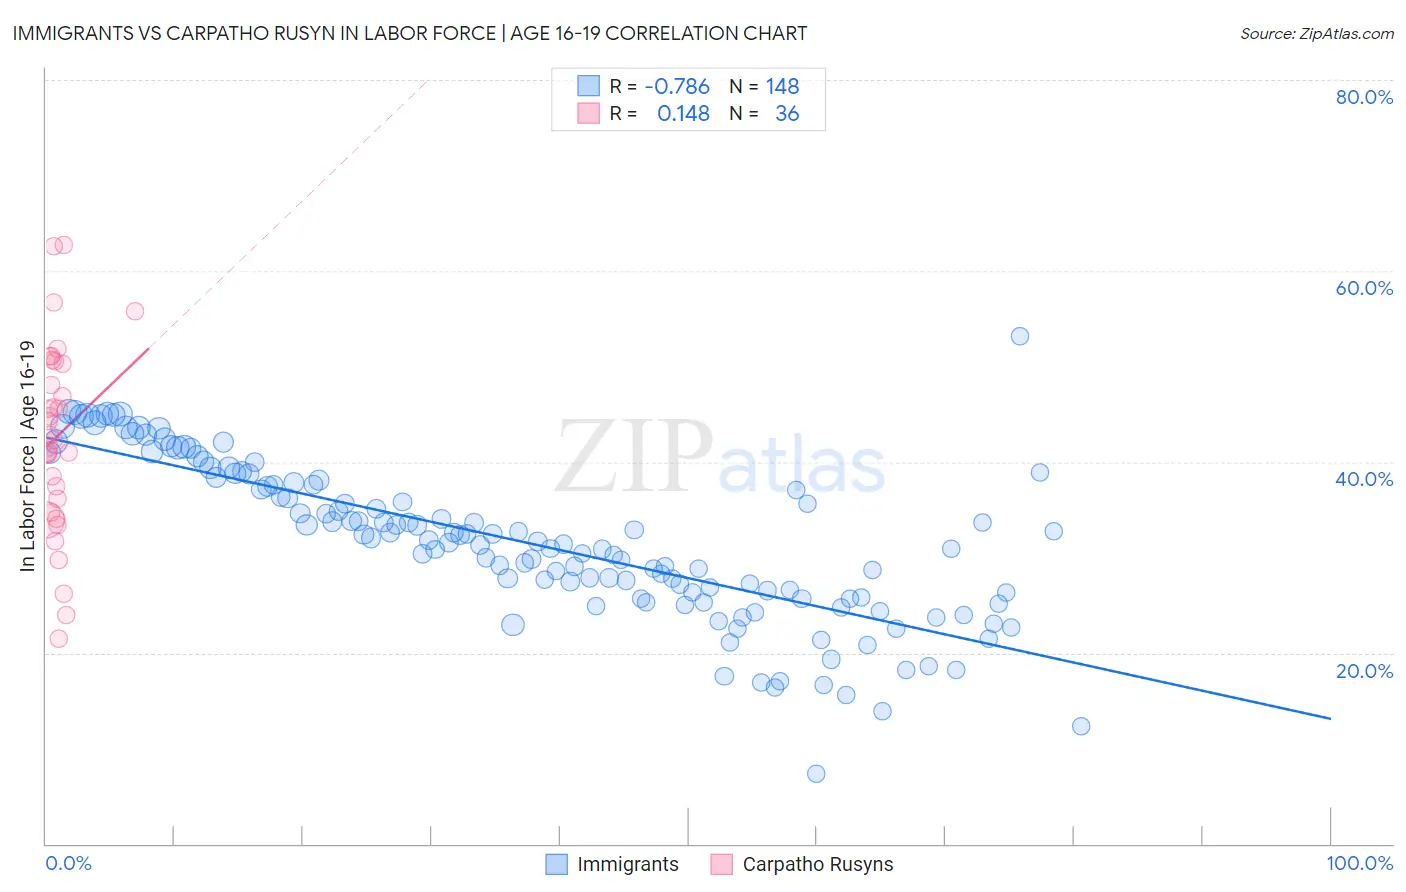
Immigrants vs Carpatho Rusyn In Labor Force | Age 16-19
COMPARE
Immigrants
Carpatho Rusyn
In Labor Force | Age 16-19
In Labor Force | Age 16-19 Comparison
Immigrants
Carpatho Rusyns
34.6%
IN LABOR FORCE | AGE 16-19
1.2/ 100
METRIC RATING
259th/ 347
METRIC RANK
40.8%
IN LABOR FORCE | AGE 16-19
100.0/ 100
METRIC RATING
47th/ 347
METRIC RANK
Immigrants vs Carpatho Rusyn In Labor Force | Age 16-19 Correlation Chart
The statistical analysis conducted on geographies consisting of 573,117,494 people shows a strong negative correlation between the proportion of Immigrants and labor force participation rate among population between the ages 16 and 19 in the United States with a correlation coefficient (R) of -0.786 and weighted average of 34.6%. Similarly, the statistical analysis conducted on geographies consisting of 58,860,785 people shows a poor positive correlation between the proportion of Carpatho Rusyns and labor force participation rate among population between the ages 16 and 19 in the United States with a correlation coefficient (R) of 0.148 and weighted average of 40.8%, a difference of 18.1%.
In Labor Force | Age 16-19 Correlation Summary
| Measurement | Immigrants | Carpatho Rusyn |
| Minimum | 7.3% | 21.5% |
| Maximum | 53.1% | 62.8% |
| Range | 45.8% | 41.3% |
| Mean | 31.5% | 42.7% |
| Median | 31.6% | 42.6% |
| Interquartile 25% (IQ1) | 25.8% | 35.4% |
| Interquartile 75% (IQ3) | 37.7% | 50.5% |
| Interquartile Range (IQR) | 12.0% | 15.1% |
| Standard Deviation (Sample) | 8.3% | 9.9% |
| Standard Deviation (Population) | 8.2% | 9.8% |
Similar Demographics by In Labor Force | Age 16-19
Demographics Similar to Immigrants by In Labor Force | Age 16-19
In terms of in labor force | age 16-19, the demographic groups most similar to Immigrants are Immigrants from Egypt (34.6%, a difference of 0.020%), Thai (34.6%, a difference of 0.020%), Immigrants from South Central Asia (34.6%, a difference of 0.030%), Egyptian (34.5%, a difference of 0.080%), and Salvadoran (34.5%, a difference of 0.12%).
| Demographics | Rating | Rank | In Labor Force | Age 16-19 |
| Immigrants | Chile | 2.0 /100 | #252 | Tragic 34.8% |
| Immigrants | Japan | 1.5 /100 | #253 | Tragic 34.7% |
| Bahamians | 1.4 /100 | #254 | Tragic 34.6% |
| Peruvians | 1.4 /100 | #255 | Tragic 34.6% |
| Immigrants | South Central Asia | 1.3 /100 | #256 | Tragic 34.6% |
| Immigrants | Egypt | 1.2 /100 | #257 | Tragic 34.6% |
| Thais | 1.2 /100 | #258 | Tragic 34.6% |
| Immigrants | Immigrants | 1.2 /100 | #259 | Tragic 34.6% |
| Egyptians | 1.2 /100 | #260 | Tragic 34.5% |
| Salvadorans | 1.1 /100 | #261 | Tragic 34.5% |
| Hispanics or Latinos | 1.1 /100 | #262 | Tragic 34.5% |
| Burmese | 1.1 /100 | #263 | Tragic 34.5% |
| Immigrants | Uruguay | 0.9 /100 | #264 | Tragic 34.4% |
| Immigrants | El Salvador | 0.7 /100 | #265 | Tragic 34.3% |
| Immigrants | Malaysia | 0.7 /100 | #266 | Tragic 34.3% |
Demographics Similar to Carpatho Rusyns by In Labor Force | Age 16-19
In terms of in labor force | age 16-19, the demographic groups most similar to Carpatho Rusyns are Icelander (40.8%, a difference of 0.050%), Cree (40.8%, a difference of 0.070%), Indonesian (40.7%, a difference of 0.23%), Immigrants from Zaire (40.7%, a difference of 0.33%), and Immigrants from Laos (40.6%, a difference of 0.42%).
| Demographics | Rating | Rank | In Labor Force | Age 16-19 |
| Immigrants | Liberia | 100.0 /100 | #40 | Exceptional 41.5% |
| Celtics | 100.0 /100 | #41 | Exceptional 41.3% |
| Whites/Caucasians | 100.0 /100 | #42 | Exceptional 41.3% |
| Tongans | 100.0 /100 | #43 | Exceptional 41.2% |
| Europeans | 100.0 /100 | #44 | Exceptional 41.1% |
| Croatians | 100.0 /100 | #45 | Exceptional 41.1% |
| Immigrants | Sudan | 100.0 /100 | #46 | Exceptional 41.0% |
| Carpatho Rusyns | 100.0 /100 | #47 | Exceptional 40.8% |
| Icelanders | 100.0 /100 | #48 | Exceptional 40.8% |
| Cree | 100.0 /100 | #49 | Exceptional 40.8% |
| Indonesians | 100.0 /100 | #50 | Exceptional 40.7% |
| Immigrants | Zaire | 100.0 /100 | #51 | Exceptional 40.7% |
| Immigrants | Laos | 100.0 /100 | #52 | Exceptional 40.6% |
| Immigrants | Kenya | 100.0 /100 | #53 | Exceptional 40.5% |
| Tlingit-Haida | 100.0 /100 | #54 | Exceptional 40.5% |