Argentinean vs Carpatho Rusyn In Labor Force | Age 16-19
COMPARE
Argentinean
Carpatho Rusyn
In Labor Force | Age 16-19
In Labor Force | Age 16-19 Comparison
Argentineans
Carpatho Rusyns
33.3%
IN LABOR FORCE | AGE 16-19
0.1/ 100
METRIC RATING
294th/ 347
METRIC RANK
40.8%
IN LABOR FORCE | AGE 16-19
100.0/ 100
METRIC RATING
47th/ 347
METRIC RANK
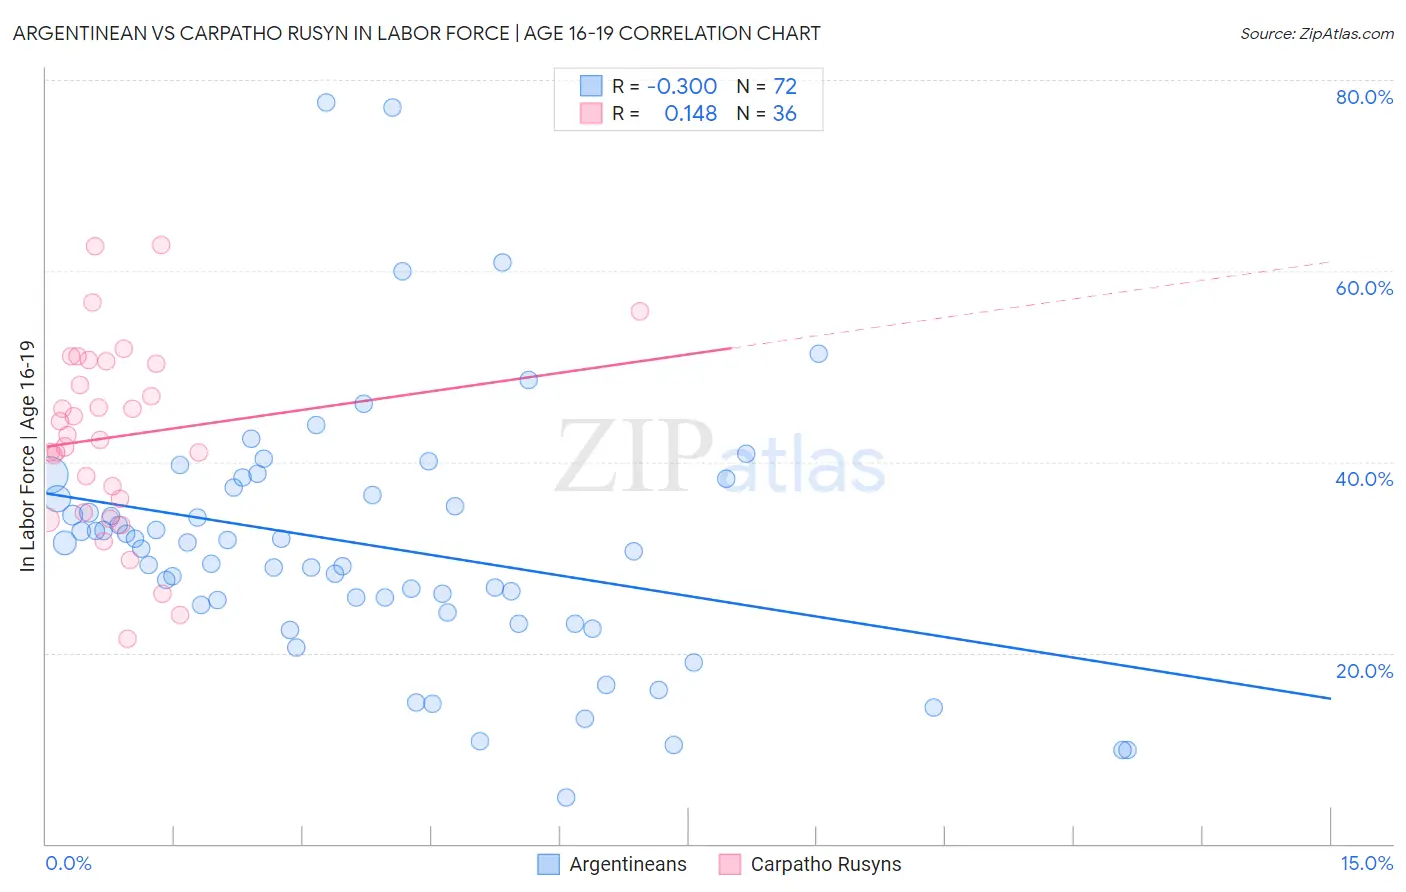
Argentinean vs Carpatho Rusyn In Labor Force | Age 16-19 Correlation Chart
The statistical analysis conducted on geographies consisting of 296,834,136 people shows a mild negative correlation between the proportion of Argentineans and labor force participation rate among population between the ages 16 and 19 in the United States with a correlation coefficient (R) of -0.300 and weighted average of 33.3%. Similarly, the statistical analysis conducted on geographies consisting of 58,860,785 people shows a poor positive correlation between the proportion of Carpatho Rusyns and labor force participation rate among population between the ages 16 and 19 in the United States with a correlation coefficient (R) of 0.148 and weighted average of 40.8%, a difference of 22.6%.
In Labor Force | Age 16-19 Correlation Summary
| Measurement | Argentinean | Carpatho Rusyn |
| Minimum | 4.8% | 21.5% |
| Maximum | 77.6% | 62.8% |
| Range | 72.8% | 41.3% |
| Mean | 31.3% | 42.7% |
| Median | 31.2% | 42.6% |
| Interquartile 25% (IQ1) | 24.6% | 35.4% |
| Interquartile 75% (IQ3) | 36.9% | 50.5% |
| Interquartile Range (IQR) | 12.3% | 15.1% |
| Standard Deviation (Sample) | 13.4% | 9.9% |
| Standard Deviation (Population) | 13.3% | 9.8% |
Similar Demographics by In Labor Force | Age 16-19
Demographics Similar to Argentineans by In Labor Force | Age 16-19
In terms of in labor force | age 16-19, the demographic groups most similar to Argentineans are Immigrants from South America (33.3%, a difference of 0.020%), Yup'ik (33.3%, a difference of 0.10%), Jamaican (33.2%, a difference of 0.23%), Immigrants from Haiti (33.2%, a difference of 0.33%), and Haitian (33.4%, a difference of 0.34%).
| Demographics | Rating | Rank | In Labor Force | Age 16-19 |
| Nepalese | 0.1 /100 | #287 | Tragic 33.5% |
| Immigrants | Indonesia | 0.1 /100 | #288 | Tragic 33.5% |
| Immigrants | Singapore | 0.1 /100 | #289 | Tragic 33.5% |
| Immigrants | Colombia | 0.1 /100 | #290 | Tragic 33.5% |
| Immigrants | Belarus | 0.1 /100 | #291 | Tragic 33.4% |
| Haitians | 0.1 /100 | #292 | Tragic 33.4% |
| Immigrants | South America | 0.1 /100 | #293 | Tragic 33.3% |
| Argentineans | 0.1 /100 | #294 | Tragic 33.3% |
| Yup'ik | 0.1 /100 | #295 | Tragic 33.3% |
| Jamaicans | 0.1 /100 | #296 | Tragic 33.2% |
| Immigrants | Haiti | 0.1 /100 | #297 | Tragic 33.2% |
| Iranians | 0.0 /100 | #298 | Tragic 33.0% |
| Armenians | 0.0 /100 | #299 | Tragic 32.9% |
| Immigrants | Argentina | 0.0 /100 | #300 | Tragic 32.9% |
| Okinawans | 0.0 /100 | #301 | Tragic 32.8% |
Demographics Similar to Carpatho Rusyns by In Labor Force | Age 16-19
In terms of in labor force | age 16-19, the demographic groups most similar to Carpatho Rusyns are Icelander (40.8%, a difference of 0.050%), Cree (40.8%, a difference of 0.070%), Indonesian (40.7%, a difference of 0.23%), Immigrants from Zaire (40.7%, a difference of 0.33%), and Immigrants from Laos (40.6%, a difference of 0.42%).
| Demographics | Rating | Rank | In Labor Force | Age 16-19 |
| Immigrants | Liberia | 100.0 /100 | #40 | Exceptional 41.5% |
| Celtics | 100.0 /100 | #41 | Exceptional 41.3% |
| Whites/Caucasians | 100.0 /100 | #42 | Exceptional 41.3% |
| Tongans | 100.0 /100 | #43 | Exceptional 41.2% |
| Europeans | 100.0 /100 | #44 | Exceptional 41.1% |
| Croatians | 100.0 /100 | #45 | Exceptional 41.1% |
| Immigrants | Sudan | 100.0 /100 | #46 | Exceptional 41.0% |
| Carpatho Rusyns | 100.0 /100 | #47 | Exceptional 40.8% |
| Icelanders | 100.0 /100 | #48 | Exceptional 40.8% |
| Cree | 100.0 /100 | #49 | Exceptional 40.8% |
| Indonesians | 100.0 /100 | #50 | Exceptional 40.7% |
| Immigrants | Zaire | 100.0 /100 | #51 | Exceptional 40.7% |
| Immigrants | Laos | 100.0 /100 | #52 | Exceptional 40.6% |
| Immigrants | Kenya | 100.0 /100 | #53 | Exceptional 40.5% |
| Tlingit-Haida | 100.0 /100 | #54 | Exceptional 40.5% |