Immigrants from Uzbekistan vs Immigrants from South Africa In Labor Force | Age 45-54
COMPARE
Immigrants from Uzbekistan
Immigrants from South Africa
In Labor Force | Age 45-54
In Labor Force | Age 45-54 Comparison
Immigrants from Uzbekistan
Immigrants from South Africa
82.3%
IN LABOR FORCE | AGE 45-54
5.8/ 100
METRIC RATING
213th/ 347
METRIC RANK
82.8%
IN LABOR FORCE | AGE 45-54
55.8/ 100
METRIC RATING
168th/ 347
METRIC RANK
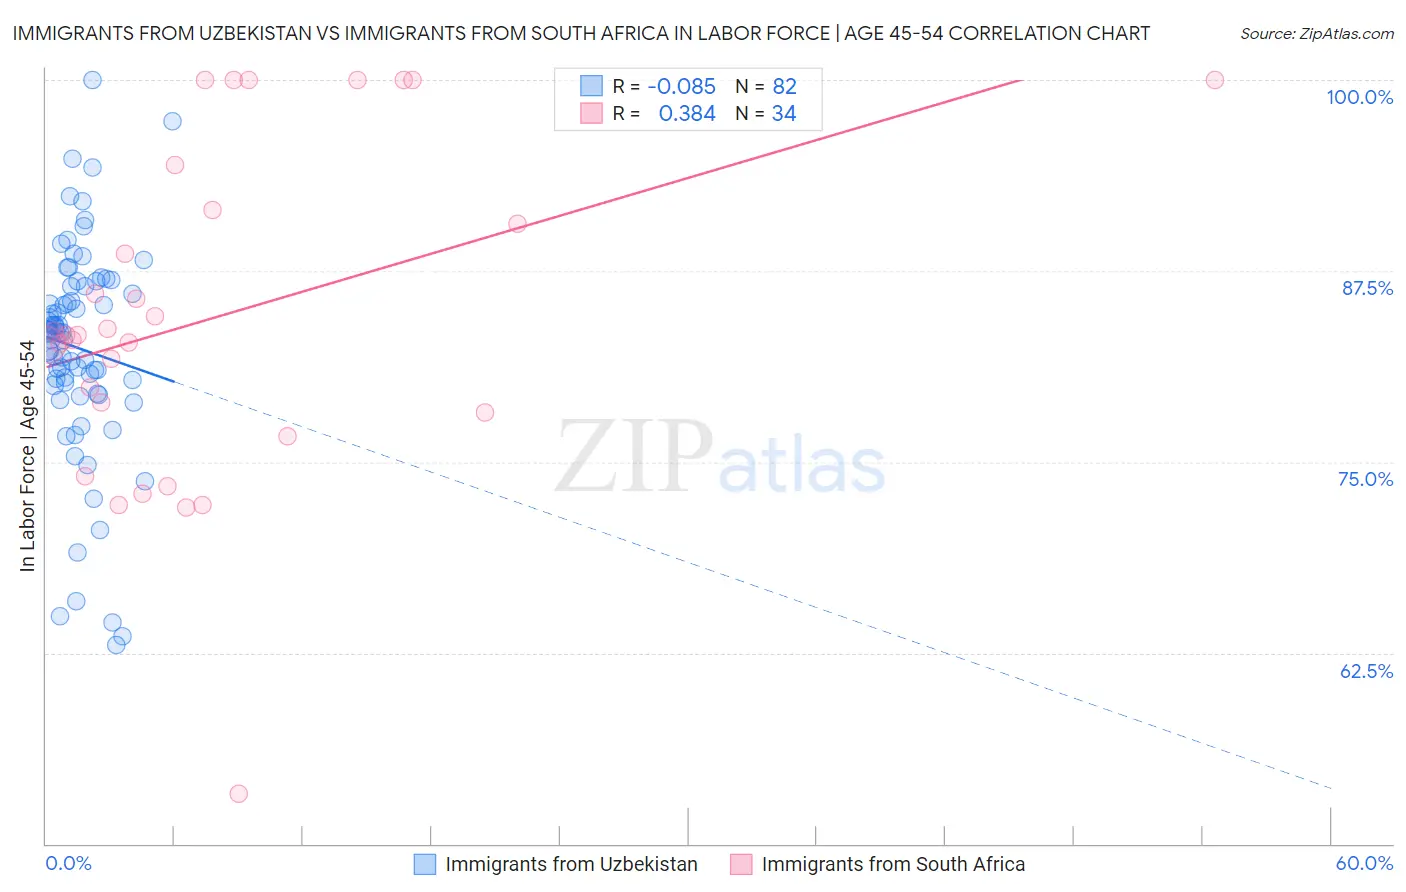
Immigrants from Uzbekistan vs Immigrants from South Africa In Labor Force | Age 45-54 Correlation Chart
The statistical analysis conducted on geographies consisting of 118,730,775 people shows a slight negative correlation between the proportion of Immigrants from Uzbekistan and labor force participation rate among population between the ages 45 and 54 in the United States with a correlation coefficient (R) of -0.085 and weighted average of 82.3%. Similarly, the statistical analysis conducted on geographies consisting of 233,265,537 people shows a mild positive correlation between the proportion of Immigrants from South Africa and labor force participation rate among population between the ages 45 and 54 in the United States with a correlation coefficient (R) of 0.384 and weighted average of 82.8%, a difference of 0.67%.
In Labor Force | Age 45-54 Correlation Summary
| Measurement | Immigrants from Uzbekistan | Immigrants from South Africa |
| Minimum | 63.0% | 53.3% |
| Maximum | 100.0% | 100.0% |
| Range | 37.0% | 46.7% |
| Mean | 82.4% | 84.5% |
| Median | 83.5% | 83.3% |
| Interquartile 25% (IQ1) | 80.0% | 78.2% |
| Interquartile 75% (IQ3) | 86.5% | 91.5% |
| Interquartile Range (IQR) | 6.5% | 13.3% |
| Standard Deviation (Sample) | 7.1% | 10.8% |
| Standard Deviation (Population) | 7.1% | 10.7% |
Similar Demographics by In Labor Force | Age 45-54
Demographics Similar to Immigrants from Uzbekistan by In Labor Force | Age 45-54
In terms of in labor force | age 45-54, the demographic groups most similar to Immigrants from Uzbekistan are Immigrants from Panama (82.2%, a difference of 0.010%), Iraqi (82.2%, a difference of 0.010%), Ecuadorian (82.3%, a difference of 0.020%), Scottish (82.2%, a difference of 0.020%), and Immigrants from Syria (82.3%, a difference of 0.030%).
| Demographics | Rating | Rank | In Labor Force | Age 45-54 |
| Welsh | 9.2 /100 | #206 | Tragic 82.3% |
| Immigrants | Cabo Verde | 8.6 /100 | #207 | Tragic 82.3% |
| Native Hawaiians | 8.5 /100 | #208 | Tragic 82.3% |
| Immigrants | Lebanon | 7.4 /100 | #209 | Tragic 82.3% |
| Immigrants | Bahamas | 7.1 /100 | #210 | Tragic 82.3% |
| Immigrants | Syria | 6.6 /100 | #211 | Tragic 82.3% |
| Ecuadorians | 6.3 /100 | #212 | Tragic 82.3% |
| Immigrants | Uzbekistan | 5.8 /100 | #213 | Tragic 82.3% |
| Immigrants | Panama | 5.6 /100 | #214 | Tragic 82.2% |
| Iraqis | 5.6 /100 | #215 | Tragic 82.2% |
| Scottish | 5.3 /100 | #216 | Tragic 82.2% |
| Portuguese | 4.7 /100 | #217 | Tragic 82.2% |
| English | 4.4 /100 | #218 | Tragic 82.2% |
| French | 4.1 /100 | #219 | Tragic 82.2% |
| Bahamians | 3.6 /100 | #220 | Tragic 82.2% |
Demographics Similar to Immigrants from South Africa by In Labor Force | Age 45-54
In terms of in labor force | age 45-54, the demographic groups most similar to Immigrants from South Africa are Immigrants from South Eastern Asia (82.8%, a difference of 0.010%), Swiss (82.8%, a difference of 0.010%), Immigrants from Western Africa (82.8%, a difference of 0.010%), Pakistani (82.8%, a difference of 0.020%), and Immigrants from Zaire (82.8%, a difference of 0.030%).
| Demographics | Rating | Rank | In Labor Force | Age 45-54 |
| South American Indians | 62.2 /100 | #161 | Good 82.9% |
| Haitians | 61.8 /100 | #162 | Good 82.8% |
| Dutch | 61.7 /100 | #163 | Good 82.8% |
| German Russians | 61.3 /100 | #164 | Good 82.8% |
| Immigrants | Sudan | 59.9 /100 | #165 | Average 82.8% |
| Immigrants | South Eastern Asia | 57.4 /100 | #166 | Average 82.8% |
| Swiss | 56.5 /100 | #167 | Average 82.8% |
| Immigrants | South Africa | 55.8 /100 | #168 | Average 82.8% |
| Immigrants | Western Africa | 54.1 /100 | #169 | Average 82.8% |
| Pakistanis | 53.2 /100 | #170 | Average 82.8% |
| Immigrants | Zaire | 52.9 /100 | #171 | Average 82.8% |
| Icelanders | 51.8 /100 | #172 | Average 82.8% |
| Nicaraguans | 50.3 /100 | #173 | Average 82.8% |
| Costa Ricans | 50.0 /100 | #174 | Average 82.8% |
| Immigrants | Liberia | 47.9 /100 | #175 | Average 82.7% |