Immigrants from Uruguay vs Yaqui In Labor Force | Age 30-34
COMPARE
Immigrants from Uruguay
Yaqui
In Labor Force | Age 30-34
In Labor Force | Age 30-34 Comparison
Immigrants from Uruguay
Yaqui
84.7%
IN LABOR FORCE | AGE 30-34
57.4/ 100
METRIC RATING
163rd/ 347
METRIC RANK
81.4%
IN LABOR FORCE | AGE 30-34
0.0/ 100
METRIC RATING
320th/ 347
METRIC RANK
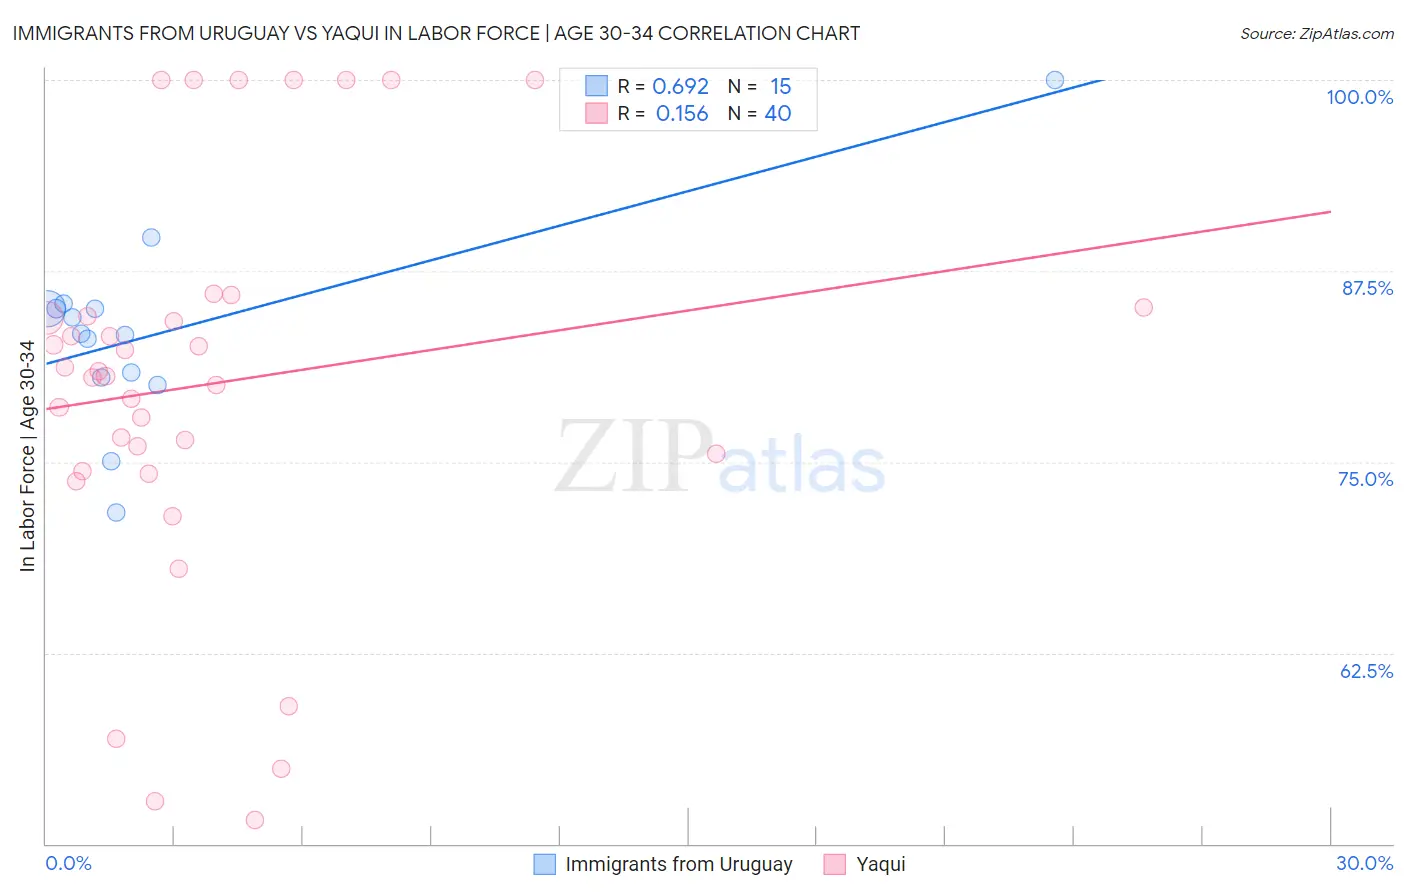
Immigrants from Uruguay vs Yaqui In Labor Force | Age 30-34 Correlation Chart
The statistical analysis conducted on geographies consisting of 133,242,034 people shows a significant positive correlation between the proportion of Immigrants from Uruguay and labor force participation rate among population between the ages 30 and 34 in the United States with a correlation coefficient (R) of 0.692 and weighted average of 84.7%. Similarly, the statistical analysis conducted on geographies consisting of 107,706,492 people shows a poor positive correlation between the proportion of Yaqui and labor force participation rate among population between the ages 30 and 34 in the United States with a correlation coefficient (R) of 0.156 and weighted average of 81.4%, a difference of 4.1%.
In Labor Force | Age 30-34 Correlation Summary
| Measurement | Immigrants from Uruguay | Yaqui |
| Minimum | 71.7% | 51.5% |
| Maximum | 100.0% | 100.0% |
| Range | 28.3% | 48.5% |
| Mean | 83.5% | 80.1% |
| Median | 83.4% | 80.8% |
| Interquartile 25% (IQ1) | 80.5% | 74.9% |
| Interquartile 75% (IQ3) | 85.1% | 84.8% |
| Interquartile Range (IQR) | 4.6% | 9.9% |
| Standard Deviation (Sample) | 6.3% | 13.0% |
| Standard Deviation (Population) | 6.1% | 12.8% |
Similar Demographics by In Labor Force | Age 30-34
Demographics Similar to Immigrants from Uruguay by In Labor Force | Age 30-34
In terms of in labor force | age 30-34, the demographic groups most similar to Immigrants from Uruguay are Icelander (84.7%, a difference of 0.0%), South American (84.7%, a difference of 0.010%), Immigrants from Western Europe (84.7%, a difference of 0.010%), Pakistani (84.7%, a difference of 0.020%), and Immigrants from Cambodia (84.7%, a difference of 0.020%).
| Demographics | Rating | Rank | In Labor Force | Age 30-34 |
| French Canadians | 67.3 /100 | #156 | Good 84.8% |
| Peruvians | 65.9 /100 | #157 | Good 84.8% |
| Immigrants | Armenia | 64.7 /100 | #158 | Good 84.8% |
| Czechoslovakians | 63.0 /100 | #159 | Good 84.8% |
| Pakistanis | 60.8 /100 | #160 | Good 84.7% |
| Immigrants | Cambodia | 60.7 /100 | #161 | Good 84.7% |
| South Americans | 58.7 /100 | #162 | Average 84.7% |
| Immigrants | Uruguay | 57.4 /100 | #163 | Average 84.7% |
| Icelanders | 56.8 /100 | #164 | Average 84.7% |
| Immigrants | Western Europe | 56.7 /100 | #165 | Average 84.7% |
| Afghans | 55.2 /100 | #166 | Average 84.7% |
| Immigrants | South Eastern Asia | 54.2 /100 | #167 | Average 84.7% |
| Immigrants | Peru | 52.4 /100 | #168 | Average 84.7% |
| South American Indians | 52.1 /100 | #169 | Average 84.7% |
| Immigrants | Burma/Myanmar | 52.0 /100 | #170 | Average 84.7% |
Demographics Similar to Yaqui by In Labor Force | Age 30-34
In terms of in labor force | age 30-34, the demographic groups most similar to Yaqui are Choctaw (81.4%, a difference of 0.020%), Shoshone (81.4%, a difference of 0.020%), Alaska Native (81.3%, a difference of 0.080%), Immigrants from the Azores (81.5%, a difference of 0.10%), and Arapaho (81.5%, a difference of 0.10%).
| Demographics | Rating | Rank | In Labor Force | Age 30-34 |
| Iroquois | 0.0 /100 | #313 | Tragic 81.9% |
| Alaskan Athabascans | 0.0 /100 | #314 | Tragic 81.7% |
| Cherokee | 0.0 /100 | #315 | Tragic 81.6% |
| Immigrants | Azores | 0.0 /100 | #316 | Tragic 81.5% |
| Arapaho | 0.0 /100 | #317 | Tragic 81.5% |
| Choctaw | 0.0 /100 | #318 | Tragic 81.4% |
| Shoshone | 0.0 /100 | #319 | Tragic 81.4% |
| Yaqui | 0.0 /100 | #320 | Tragic 81.4% |
| Alaska Natives | 0.0 /100 | #321 | Tragic 81.3% |
| Puerto Ricans | 0.0 /100 | #322 | Tragic 81.2% |
| Paiute | 0.0 /100 | #323 | Tragic 81.2% |
| Cheyenne | 0.0 /100 | #324 | Tragic 81.1% |
| Dutch West Indians | 0.0 /100 | #325 | Tragic 81.0% |
| Seminole | 0.0 /100 | #326 | Tragic 80.8% |
| Colville | 0.0 /100 | #327 | Tragic 80.7% |