Immigrants from South America vs Yaqui In Labor Force | Age 30-34
COMPARE
Immigrants from South America
Yaqui
In Labor Force | Age 30-34
In Labor Force | Age 30-34 Comparison
Immigrants from South America
Yaqui
84.7%
IN LABOR FORCE | AGE 30-34
50.0/ 100
METRIC RATING
175th/ 347
METRIC RANK
81.4%
IN LABOR FORCE | AGE 30-34
0.0/ 100
METRIC RATING
320th/ 347
METRIC RANK
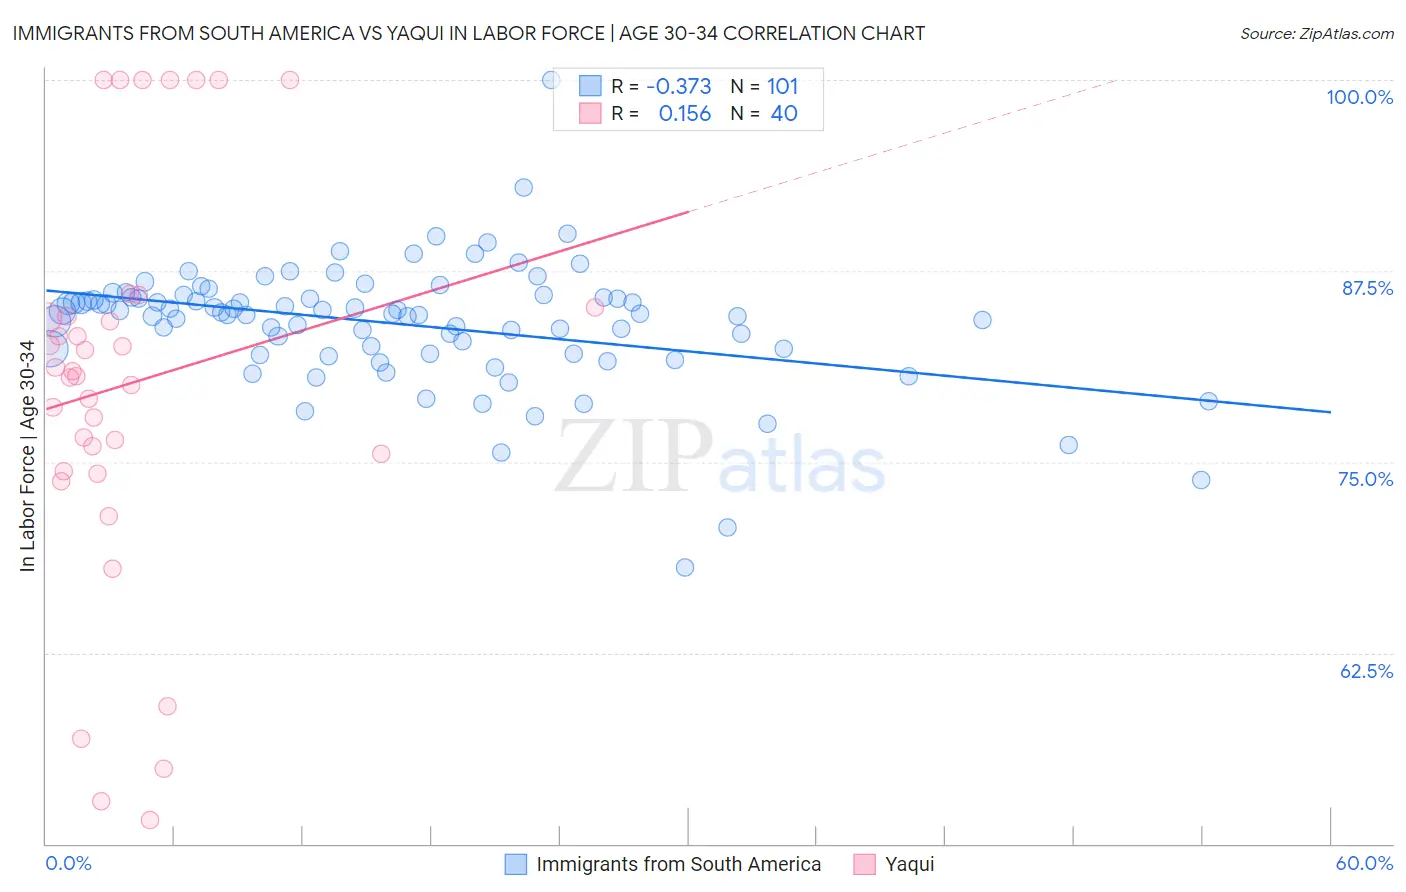
Immigrants from South America vs Yaqui In Labor Force | Age 30-34 Correlation Chart
The statistical analysis conducted on geographies consisting of 485,985,237 people shows a mild negative correlation between the proportion of Immigrants from South America and labor force participation rate among population between the ages 30 and 34 in the United States with a correlation coefficient (R) of -0.373 and weighted average of 84.7%. Similarly, the statistical analysis conducted on geographies consisting of 107,706,492 people shows a poor positive correlation between the proportion of Yaqui and labor force participation rate among population between the ages 30 and 34 in the United States with a correlation coefficient (R) of 0.156 and weighted average of 81.4%, a difference of 4.0%.
In Labor Force | Age 30-34 Correlation Summary
| Measurement | Immigrants from South America | Yaqui |
| Minimum | 68.1% | 51.5% |
| Maximum | 100.0% | 100.0% |
| Range | 31.9% | 48.5% |
| Mean | 84.0% | 80.1% |
| Median | 84.7% | 80.8% |
| Interquartile 25% (IQ1) | 82.3% | 74.9% |
| Interquartile 75% (IQ3) | 85.8% | 84.8% |
| Interquartile Range (IQR) | 3.5% | 9.9% |
| Standard Deviation (Sample) | 4.1% | 13.0% |
| Standard Deviation (Population) | 4.1% | 12.8% |
Similar Demographics by In Labor Force | Age 30-34
Demographics Similar to Immigrants from South America by In Labor Force | Age 30-34
In terms of in labor force | age 30-34, the demographic groups most similar to Immigrants from South America are Finnish (84.7%, a difference of 0.0%), Immigrants from Burma/Myanmar (84.7%, a difference of 0.010%), Irish (84.7%, a difference of 0.010%), Immigrants from England (84.7%, a difference of 0.010%), and Israeli (84.7%, a difference of 0.010%).
| Demographics | Rating | Rank | In Labor Force | Age 30-34 |
| Immigrants | Peru | 52.4 /100 | #168 | Average 84.7% |
| South American Indians | 52.1 /100 | #169 | Average 84.7% |
| Immigrants | Burma/Myanmar | 52.0 /100 | #170 | Average 84.7% |
| Irish | 52.0 /100 | #171 | Average 84.7% |
| Immigrants | England | 51.7 /100 | #172 | Average 84.7% |
| Israelis | 51.1 /100 | #173 | Average 84.7% |
| Finns | 50.0 /100 | #174 | Average 84.7% |
| Immigrants | South America | 50.0 /100 | #175 | Average 84.7% |
| Immigrants | Uzbekistan | 49.1 /100 | #176 | Average 84.7% |
| Laotians | 46.9 /100 | #177 | Average 84.7% |
| Okinawans | 44.1 /100 | #178 | Average 84.6% |
| Immigrants | Nigeria | 42.5 /100 | #179 | Average 84.6% |
| Immigrants | Netherlands | 42.1 /100 | #180 | Average 84.6% |
| Moroccans | 40.3 /100 | #181 | Average 84.6% |
| Barbadians | 36.7 /100 | #182 | Fair 84.6% |
Demographics Similar to Yaqui by In Labor Force | Age 30-34
In terms of in labor force | age 30-34, the demographic groups most similar to Yaqui are Choctaw (81.4%, a difference of 0.020%), Shoshone (81.4%, a difference of 0.020%), Alaska Native (81.3%, a difference of 0.080%), Immigrants from the Azores (81.5%, a difference of 0.10%), and Arapaho (81.5%, a difference of 0.10%).
| Demographics | Rating | Rank | In Labor Force | Age 30-34 |
| Iroquois | 0.0 /100 | #313 | Tragic 81.9% |
| Alaskan Athabascans | 0.0 /100 | #314 | Tragic 81.7% |
| Cherokee | 0.0 /100 | #315 | Tragic 81.6% |
| Immigrants | Azores | 0.0 /100 | #316 | Tragic 81.5% |
| Arapaho | 0.0 /100 | #317 | Tragic 81.5% |
| Choctaw | 0.0 /100 | #318 | Tragic 81.4% |
| Shoshone | 0.0 /100 | #319 | Tragic 81.4% |
| Yaqui | 0.0 /100 | #320 | Tragic 81.4% |
| Alaska Natives | 0.0 /100 | #321 | Tragic 81.3% |
| Puerto Ricans | 0.0 /100 | #322 | Tragic 81.2% |
| Paiute | 0.0 /100 | #323 | Tragic 81.2% |
| Cheyenne | 0.0 /100 | #324 | Tragic 81.1% |
| Dutch West Indians | 0.0 /100 | #325 | Tragic 81.0% |
| Seminole | 0.0 /100 | #326 | Tragic 80.8% |
| Colville | 0.0 /100 | #327 | Tragic 80.7% |