Immigrants from Uruguay vs Immigrants from Lebanon In Labor Force | Age 25-29
COMPARE
Immigrants from Uruguay
Immigrants from Lebanon
In Labor Force | Age 25-29
In Labor Force | Age 25-29 Comparison
Immigrants from Uruguay
Immigrants from Lebanon
84.9%
IN LABOR FORCE | AGE 25-29
84.0/ 100
METRIC RATING
127th/ 347
METRIC RANK
83.4%
IN LABOR FORCE | AGE 25-29
0.0/ 100
METRIC RATING
268th/ 347
METRIC RANK
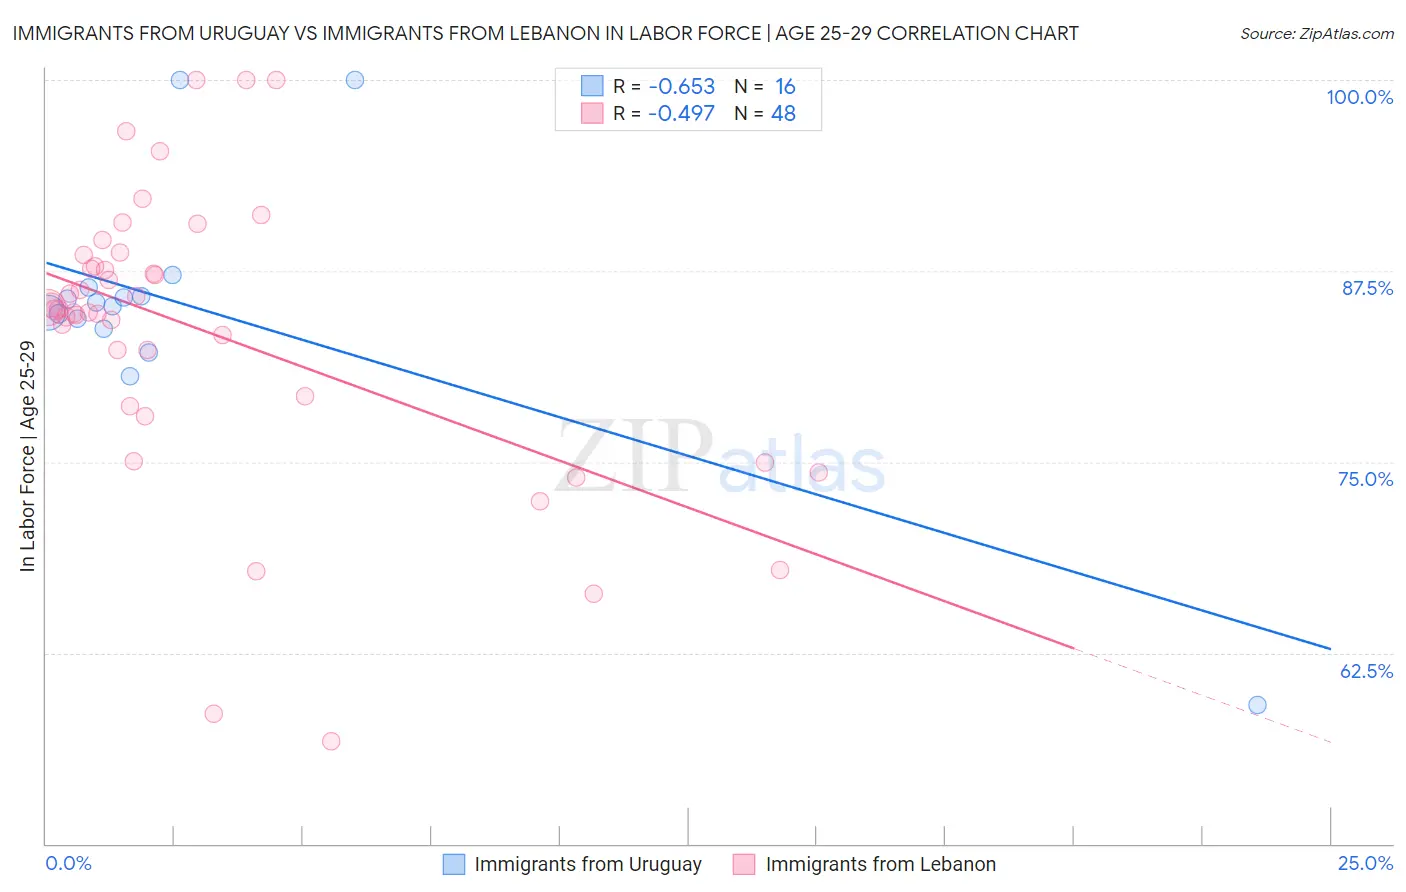
Immigrants from Uruguay vs Immigrants from Lebanon In Labor Force | Age 25-29 Correlation Chart
The statistical analysis conducted on geographies consisting of 133,247,339 people shows a significant negative correlation between the proportion of Immigrants from Uruguay and labor force participation rate among population between the ages 25 and 29 in the United States with a correlation coefficient (R) of -0.653 and weighted average of 84.9%. Similarly, the statistical analysis conducted on geographies consisting of 217,137,531 people shows a moderate negative correlation between the proportion of Immigrants from Lebanon and labor force participation rate among population between the ages 25 and 29 in the United States with a correlation coefficient (R) of -0.497 and weighted average of 83.4%, a difference of 1.8%.
In Labor Force | Age 25-29 Correlation Summary
| Measurement | Immigrants from Uruguay | Immigrants from Lebanon |
| Minimum | 59.1% | 56.7% |
| Maximum | 100.0% | 100.0% |
| Range | 40.9% | 43.3% |
| Mean | 85.1% | 83.5% |
| Median | 85.3% | 85.0% |
| Interquartile 25% (IQ1) | 84.0% | 79.0% |
| Interquartile 75% (IQ3) | 86.1% | 88.2% |
| Interquartile Range (IQR) | 2.1% | 9.2% |
| Standard Deviation (Sample) | 8.8% | 9.5% |
| Standard Deviation (Population) | 8.5% | 9.4% |
Similar Demographics by In Labor Force | Age 25-29
Demographics Similar to Immigrants from Uruguay by In Labor Force | Age 25-29
In terms of in labor force | age 25-29, the demographic groups most similar to Immigrants from Uruguay are Dutch (84.9%, a difference of 0.010%), Immigrants from Iran (84.9%, a difference of 0.010%), Uruguayan (84.9%, a difference of 0.010%), Immigrants from Singapore (84.9%, a difference of 0.010%), and Australian (84.9%, a difference of 0.010%).
| Demographics | Rating | Rank | In Labor Force | Age 25-29 |
| Immigrants | South Africa | 86.1 /100 | #120 | Excellent 84.9% |
| Immigrants | Chile | 85.6 /100 | #121 | Excellent 84.9% |
| Scandinavians | 85.1 /100 | #122 | Excellent 84.9% |
| Dutch | 84.9 /100 | #123 | Excellent 84.9% |
| Immigrants | Iran | 84.8 /100 | #124 | Excellent 84.9% |
| Uruguayans | 84.7 /100 | #125 | Excellent 84.9% |
| Immigrants | Singapore | 84.4 /100 | #126 | Excellent 84.9% |
| Immigrants | Uruguay | 84.0 /100 | #127 | Excellent 84.9% |
| Australians | 83.6 /100 | #128 | Excellent 84.9% |
| Immigrants | Russia | 81.6 /100 | #129 | Excellent 84.9% |
| Northern Europeans | 81.3 /100 | #130 | Excellent 84.9% |
| Iranians | 78.1 /100 | #131 | Good 84.8% |
| Romanians | 77.7 /100 | #132 | Good 84.8% |
| Asians | 77.7 /100 | #133 | Good 84.8% |
| Syrians | 76.5 /100 | #134 | Good 84.8% |
Demographics Similar to Immigrants from Lebanon by In Labor Force | Age 25-29
In terms of in labor force | age 25-29, the demographic groups most similar to Immigrants from Lebanon are Immigrants from Barbados (83.4%, a difference of 0.0%), Spanish American (83.4%, a difference of 0.010%), Aleut (83.4%, a difference of 0.020%), Basque (83.4%, a difference of 0.020%), and Honduran (83.4%, a difference of 0.040%).
| Demographics | Rating | Rank | In Labor Force | Age 25-29 |
| Pennsylvania Germans | 0.1 /100 | #261 | Tragic 83.6% |
| Immigrants | Fiji | 0.1 /100 | #262 | Tragic 83.6% |
| West Indians | 0.1 /100 | #263 | Tragic 83.5% |
| Puget Sound Salish | 0.1 /100 | #264 | Tragic 83.5% |
| Cubans | 0.1 /100 | #265 | Tragic 83.5% |
| Aleuts | 0.0 /100 | #266 | Tragic 83.4% |
| Spanish Americans | 0.0 /100 | #267 | Tragic 83.4% |
| Immigrants | Lebanon | 0.0 /100 | #268 | Tragic 83.4% |
| Immigrants | Barbados | 0.0 /100 | #269 | Tragic 83.4% |
| Basques | 0.0 /100 | #270 | Tragic 83.4% |
| Hondurans | 0.0 /100 | #271 | Tragic 83.4% |
| Immigrants | Caribbean | 0.0 /100 | #272 | Tragic 83.4% |
| Immigrants | Dominica | 0.0 /100 | #273 | Tragic 83.4% |
| Marshallese | 0.0 /100 | #274 | Tragic 83.3% |
| Samoans | 0.0 /100 | #275 | Tragic 83.3% |