Immigrants from Uganda vs Assyrian/Chaldean/Syriac In Labor Force | Age 45-54
COMPARE
Immigrants from Uganda
Assyrian/Chaldean/Syriac
In Labor Force | Age 45-54
In Labor Force | Age 45-54 Comparison
Immigrants from Uganda
Assyrians/Chaldeans/Syriacs
83.7%
IN LABOR FORCE | AGE 45-54
99.4/ 100
METRIC RATING
40th/ 347
METRIC RANK
83.2%
IN LABOR FORCE | AGE 45-54
91.7/ 100
METRIC RATING
114th/ 347
METRIC RANK
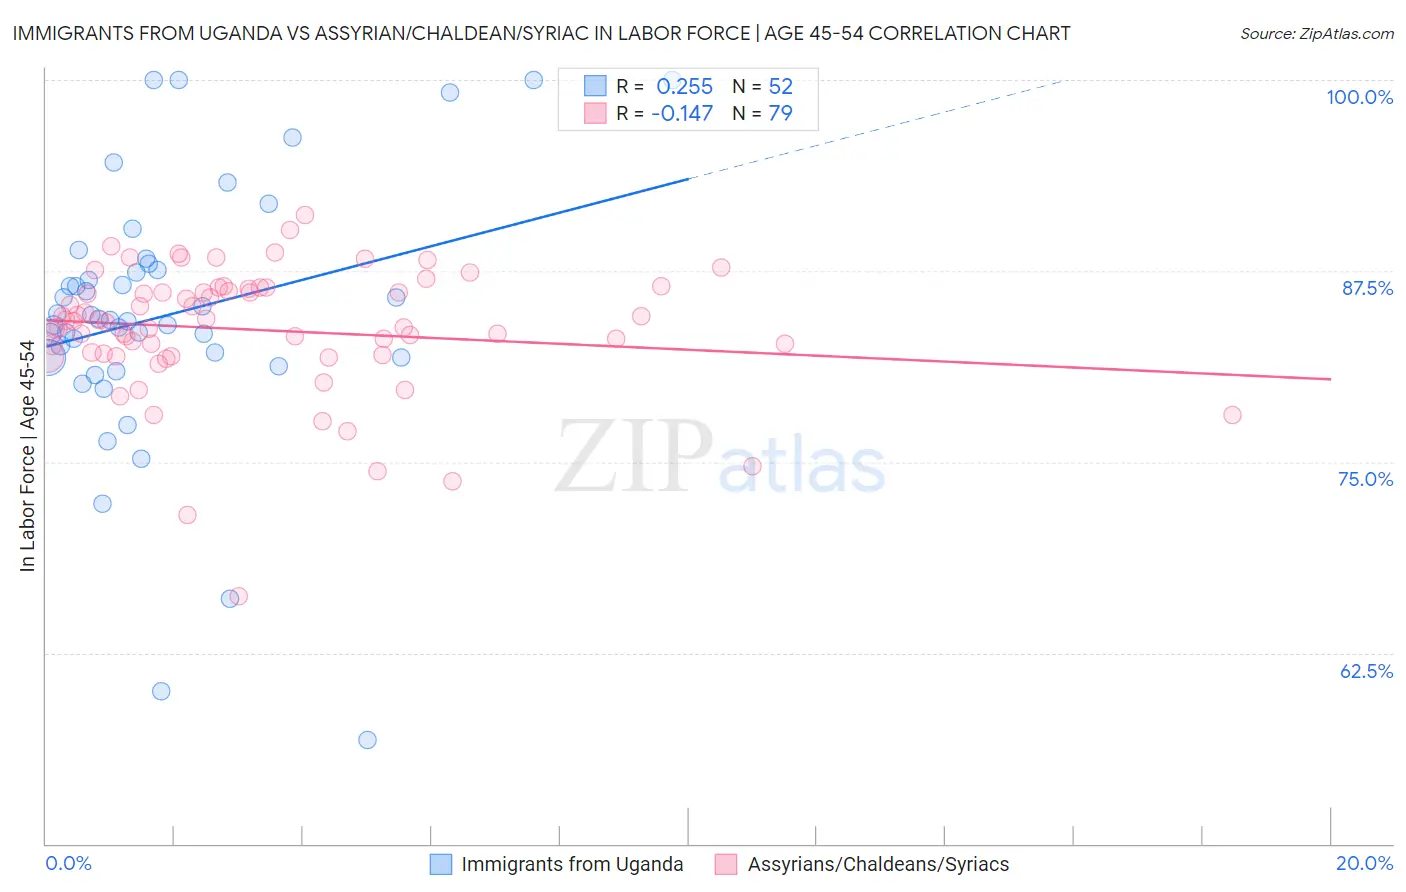
Immigrants from Uganda vs Assyrian/Chaldean/Syriac In Labor Force | Age 45-54 Correlation Chart
The statistical analysis conducted on geographies consisting of 125,971,535 people shows a weak positive correlation between the proportion of Immigrants from Uganda and labor force participation rate among population between the ages 45 and 54 in the United States with a correlation coefficient (R) of 0.255 and weighted average of 83.7%. Similarly, the statistical analysis conducted on geographies consisting of 110,290,950 people shows a poor negative correlation between the proportion of Assyrians/Chaldeans/Syriacs and labor force participation rate among population between the ages 45 and 54 in the United States with a correlation coefficient (R) of -0.147 and weighted average of 83.2%, a difference of 0.58%.
In Labor Force | Age 45-54 Correlation Summary
| Measurement | Immigrants from Uganda | Assyrian/Chaldean/Syriac |
| Minimum | 56.8% | 66.2% |
| Maximum | 100.0% | 91.2% |
| Range | 43.2% | 25.0% |
| Mean | 84.6% | 83.6% |
| Median | 84.3% | 84.2% |
| Interquartile 25% (IQ1) | 81.8% | 82.0% |
| Interquartile 75% (IQ3) | 87.8% | 86.3% |
| Interquartile Range (IQR) | 6.0% | 4.3% |
| Standard Deviation (Sample) | 8.7% | 4.2% |
| Standard Deviation (Population) | 8.6% | 4.2% |
Similar Demographics by In Labor Force | Age 45-54
Demographics Similar to Immigrants from Uganda by In Labor Force | Age 45-54
In terms of in labor force | age 45-54, the demographic groups most similar to Immigrants from Uganda are Immigrants from Venezuela (83.7%, a difference of 0.010%), Immigrants from Cuba (83.7%, a difference of 0.010%), Immigrants from Korea (83.7%, a difference of 0.010%), Immigrants from Moldova (83.7%, a difference of 0.010%), and Swedish (83.7%, a difference of 0.020%).
| Demographics | Rating | Rank | In Labor Force | Age 45-54 |
| Latvians | 99.7 /100 | #33 | Exceptional 83.8% |
| Kenyans | 99.5 /100 | #34 | Exceptional 83.7% |
| Brazilians | 99.5 /100 | #35 | Exceptional 83.7% |
| Ugandans | 99.5 /100 | #36 | Exceptional 83.7% |
| Swedes | 99.4 /100 | #37 | Exceptional 83.7% |
| Immigrants | Venezuela | 99.4 /100 | #38 | Exceptional 83.7% |
| Immigrants | Cuba | 99.4 /100 | #39 | Exceptional 83.7% |
| Immigrants | Uganda | 99.4 /100 | #40 | Exceptional 83.7% |
| Immigrants | Korea | 99.3 /100 | #41 | Exceptional 83.7% |
| Immigrants | Moldova | 99.3 /100 | #42 | Exceptional 83.7% |
| Venezuelans | 99.2 /100 | #43 | Exceptional 83.6% |
| Burmese | 99.1 /100 | #44 | Exceptional 83.6% |
| Immigrants | Hong Kong | 99.1 /100 | #45 | Exceptional 83.6% |
| Lithuanians | 99.1 /100 | #46 | Exceptional 83.6% |
| Croatians | 99.0 /100 | #47 | Exceptional 83.6% |
Demographics Similar to Assyrians/Chaldeans/Syriacs by In Labor Force | Age 45-54
In terms of in labor force | age 45-54, the demographic groups most similar to Assyrians/Chaldeans/Syriacs are Immigrants from Albania (83.2%, a difference of 0.0%), Immigrants from Chile (83.2%, a difference of 0.0%), Immigrants from Malaysia (83.2%, a difference of 0.010%), Immigrants from Italy (83.2%, a difference of 0.020%), and Immigrants from Afghanistan (83.2%, a difference of 0.020%).
| Demographics | Rating | Rank | In Labor Force | Age 45-54 |
| Iranians | 92.9 /100 | #107 | Exceptional 83.2% |
| Slovaks | 92.8 /100 | #108 | Exceptional 83.2% |
| Ukrainians | 92.7 /100 | #109 | Exceptional 83.2% |
| Immigrants | Africa | 92.6 /100 | #110 | Exceptional 83.2% |
| Immigrants | Italy | 92.5 /100 | #111 | Exceptional 83.2% |
| Immigrants | Afghanistan | 92.4 /100 | #112 | Exceptional 83.2% |
| Immigrants | Albania | 91.8 /100 | #113 | Exceptional 83.2% |
| Assyrians/Chaldeans/Syriacs | 91.7 /100 | #114 | Exceptional 83.2% |
| Immigrants | Chile | 91.6 /100 | #115 | Exceptional 83.2% |
| Immigrants | Malaysia | 91.4 /100 | #116 | Exceptional 83.2% |
| Immigrants | China | 90.9 /100 | #117 | Exceptional 83.2% |
| Immigrants | Europe | 90.7 /100 | #118 | Exceptional 83.2% |
| Immigrants | Uruguay | 90.2 /100 | #119 | Exceptional 83.2% |
| Immigrants | Russia | 90.1 /100 | #120 | Exceptional 83.2% |
| Uruguayans | 89.4 /100 | #121 | Excellent 83.1% |