Immigrants from Uganda vs Houma In Labor Force | Age 45-54
COMPARE
Immigrants from Uganda
Houma
In Labor Force | Age 45-54
In Labor Force | Age 45-54 Comparison
Immigrants from Uganda
Houma
83.7%
IN LABOR FORCE | AGE 45-54
99.4/ 100
METRIC RATING
40th/ 347
METRIC RANK
74.1%
IN LABOR FORCE | AGE 45-54
0.0/ 100
METRIC RATING
345th/ 347
METRIC RANK
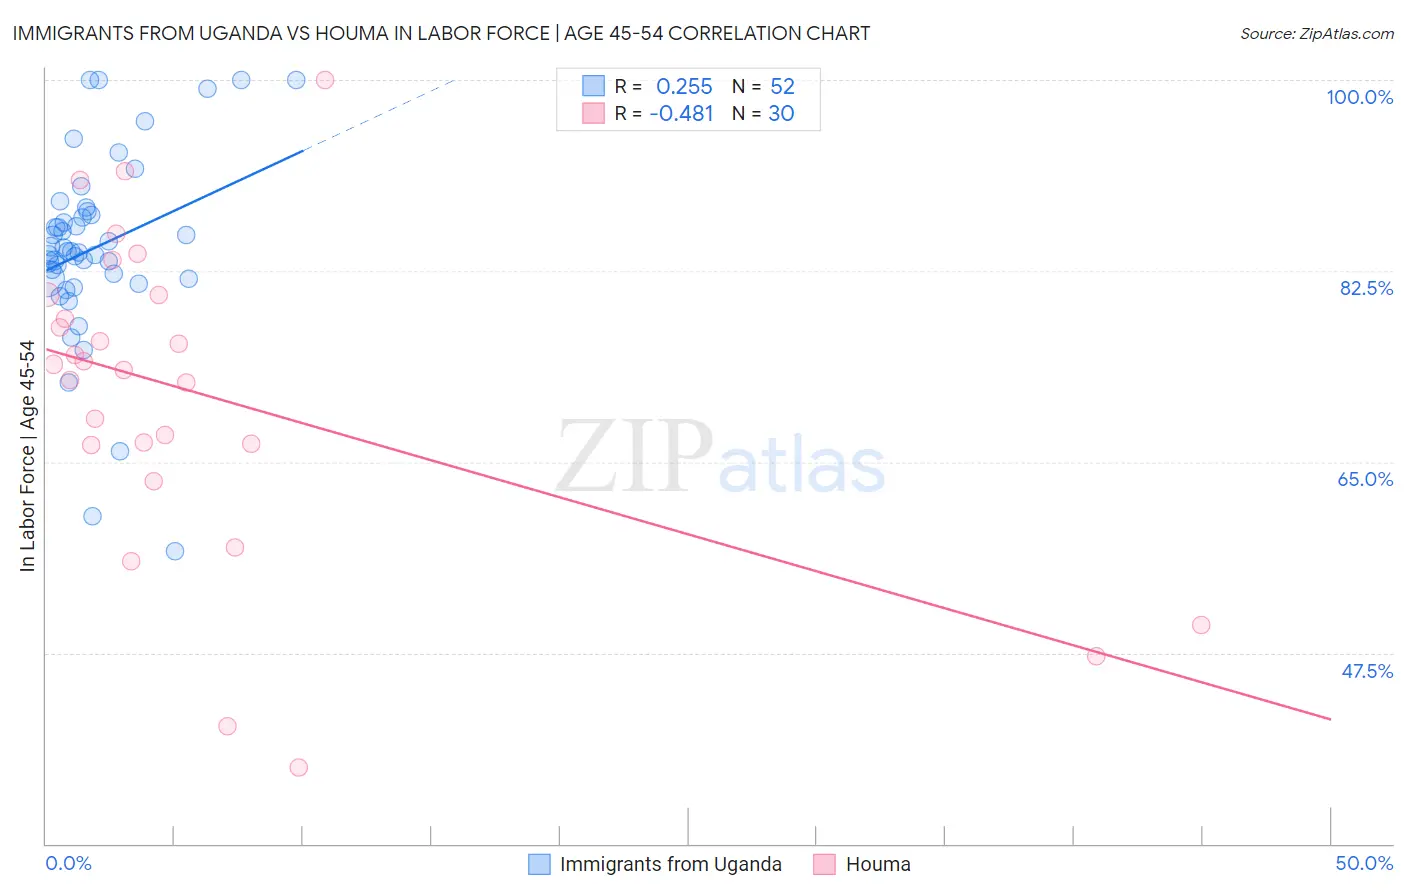
Immigrants from Uganda vs Houma In Labor Force | Age 45-54 Correlation Chart
The statistical analysis conducted on geographies consisting of 125,971,535 people shows a weak positive correlation between the proportion of Immigrants from Uganda and labor force participation rate among population between the ages 45 and 54 in the United States with a correlation coefficient (R) of 0.255 and weighted average of 83.7%. Similarly, the statistical analysis conducted on geographies consisting of 36,792,194 people shows a moderate negative correlation between the proportion of Houma and labor force participation rate among population between the ages 45 and 54 in the United States with a correlation coefficient (R) of -0.481 and weighted average of 74.1%, a difference of 13.0%.
In Labor Force | Age 45-54 Correlation Summary
| Measurement | Immigrants from Uganda | Houma |
| Minimum | 56.8% | 37.0% |
| Maximum | 100.0% | 100.0% |
| Range | 43.2% | 63.0% |
| Mean | 84.6% | 71.1% |
| Median | 84.3% | 73.7% |
| Interquartile 25% (IQ1) | 81.8% | 66.6% |
| Interquartile 75% (IQ3) | 87.8% | 80.3% |
| Interquartile Range (IQR) | 6.0% | 13.7% |
| Standard Deviation (Sample) | 8.7% | 14.6% |
| Standard Deviation (Population) | 8.6% | 14.4% |
Similar Demographics by In Labor Force | Age 45-54
Demographics Similar to Immigrants from Uganda by In Labor Force | Age 45-54
In terms of in labor force | age 45-54, the demographic groups most similar to Immigrants from Uganda are Immigrants from Venezuela (83.7%, a difference of 0.010%), Immigrants from Cuba (83.7%, a difference of 0.010%), Immigrants from Korea (83.7%, a difference of 0.010%), Immigrants from Moldova (83.7%, a difference of 0.010%), and Swedish (83.7%, a difference of 0.020%).
| Demographics | Rating | Rank | In Labor Force | Age 45-54 |
| Latvians | 99.7 /100 | #33 | Exceptional 83.8% |
| Kenyans | 99.5 /100 | #34 | Exceptional 83.7% |
| Brazilians | 99.5 /100 | #35 | Exceptional 83.7% |
| Ugandans | 99.5 /100 | #36 | Exceptional 83.7% |
| Swedes | 99.4 /100 | #37 | Exceptional 83.7% |
| Immigrants | Venezuela | 99.4 /100 | #38 | Exceptional 83.7% |
| Immigrants | Cuba | 99.4 /100 | #39 | Exceptional 83.7% |
| Immigrants | Uganda | 99.4 /100 | #40 | Exceptional 83.7% |
| Immigrants | Korea | 99.3 /100 | #41 | Exceptional 83.7% |
| Immigrants | Moldova | 99.3 /100 | #42 | Exceptional 83.7% |
| Venezuelans | 99.2 /100 | #43 | Exceptional 83.6% |
| Burmese | 99.1 /100 | #44 | Exceptional 83.6% |
| Immigrants | Hong Kong | 99.1 /100 | #45 | Exceptional 83.6% |
| Lithuanians | 99.1 /100 | #46 | Exceptional 83.6% |
| Croatians | 99.0 /100 | #47 | Exceptional 83.6% |
Demographics Similar to Houma by In Labor Force | Age 45-54
In terms of in labor force | age 45-54, the demographic groups most similar to Houma are Immigrants from Yemen (74.4%, a difference of 0.48%), Hopi (75.0%, a difference of 1.3%), Tohono O'odham (75.1%, a difference of 1.4%), Pima (72.8%, a difference of 1.7%), and Navajo (72.8%, a difference of 1.8%).
| Demographics | Rating | Rank | In Labor Force | Age 45-54 |
| Natives/Alaskans | 0.0 /100 | #333 | Tragic 77.1% |
| Apache | 0.0 /100 | #334 | Tragic 77.1% |
| Arapaho | 0.0 /100 | #335 | Tragic 77.1% |
| Paiute | 0.0 /100 | #336 | Tragic 76.7% |
| Ute | 0.0 /100 | #337 | Tragic 76.6% |
| Yuman | 0.0 /100 | #338 | Tragic 76.3% |
| Puerto Ricans | 0.0 /100 | #339 | Tragic 75.9% |
| Lumbee | 0.0 /100 | #340 | Tragic 75.6% |
| Pueblo | 0.0 /100 | #341 | Tragic 75.5% |
| Tohono O'odham | 0.0 /100 | #342 | Tragic 75.1% |
| Hopi | 0.0 /100 | #343 | Tragic 75.0% |
| Immigrants | Yemen | 0.0 /100 | #344 | Tragic 74.4% |
| Houma | 0.0 /100 | #345 | Tragic 74.1% |
| Pima | 0.0 /100 | #346 | Tragic 72.8% |
| Navajo | 0.0 /100 | #347 | Tragic 72.8% |