Immigrants from Trinidad and Tobago vs Immigrants from Eastern Asia In Labor Force | Age 35-44

COMPARE

Immigrants from Trinidad and Tobago
Race
Ancestry
AfghanAfricanAlaska NativeAlaskan AthabascanAlbanianAleutAlsatianAmericanApacheArabArapahoArgentineanArmenianAssyrian/Chaldean/SyriacAustralianAustrianBahamianBangladeshiBarbadianBasqueBelgianBelizeanBermudanBhutaneseBlackfeetBolivianBrazilianBritishBritish West IndianBulgarianBurmeseCajunCambodianCanadianCape VerdeanCarpatho RusynCelticCentral AmericanCentral American IndianCherokeeCheyenneChickasawChileanChineseChippewaChoctawColombianColvilleComancheCosta RicanCreeCreekCroatianCrowCubanCypriotCzechCzechoslovakianDanishDelawareDominicanDutchDutch West IndianEastern EuropeanEcuadorianEgyptianEnglishEstonianEthiopianEuropeanFijianFilipinoFinnishFrenchFrench American IndianFrench CanadianGermanGerman RussianGhanaianGreekGuamanian/ChamorroGuatemalanGuyaneseHaitianHmongHonduranHopiHoumaHungarianIcelanderIndian (Asian)IndonesianInupiatIranianIraqiIrishIroquoisIsraeliItalianJamaicanJapaneseJordanianKenyanKiowaKoreanLaotianLatvianLebaneseLiberianLithuanianLumbeeLuxembourgerMacedonianMalaysianMalteseMarshalleseMenomineeMexicanMexican American IndianMongolianMoroccanNative HawaiianNavajoNepaleseNew ZealanderNicaraguanNigerianNorthern EuropeanNorwegianOkinawanOsageOttawaPaiutePakistaniPalestinianPanamanianParaguayanPennsylvania GermanPeruvianPimaPolishPortuguesePotawatomiPuebloPuerto RicanPuget Sound SalishRomanianRussianSalvadoranSamoanScandinavianScotch-IrishScottishSeminoleSenegaleseSerbianShoshoneSierra LeoneanSiouxSlavicSlovakSloveneSomaliSouth AfricanSouth AmericanSouth American IndianSoviet UnionSpaniardSpanishSpanish AmericanSpanish American IndianSri LankanSubsaharan AfricanSudaneseSwedishSwissSyrianTaiwaneseThaiTlingit-HaidaTohono O'OdhamTonganTrinidadian and TobagonianTsimshianTurkishU.S. Virgin IslanderUgandanUkrainianUruguayanUteVenezuelanVietnameseWelshWest IndianYakamaYaquiYugoslavianYumanYup'ikZimbabwean
Immigration
NonimmigrantsImmigrantsAfghanistanAfricaAlbaniaArgentinaArmeniaAsiaAustraliaAustriaBahamasBangladeshBarbadosBelarusBelgiumBelizeBoliviaBosnia and HerzegovinaBrazilBulgariaBurma/MyanmarCabo VerdeCambodiaCameroonCanadaCaribbeanCentral AmericaChileChinaColombiaCongoCosta RicaCroatiaCubaCzechoslovakiaDenmarkDominicaDominican RepublicEastern AfricaEastern EuropeEcuadorEgyptEl SalvadorEnglandEritreaEthiopiaEuropeFijiFranceGermanyGhanaGreeceGrenadaGuatemalaGuyanaHaitiHondurasHong KongHungaryIndiaIndonesiaIranIraqIrelandIsraelItalyJamaicaJapanJordanKazakhstanKenyaKoreaKuwaitLaosLatin AmericaLatviaLebanonLiberiaLithuaniaMalaysiaMexicoMicronesiaMiddle AfricaMoldovaMoroccoNepalNetherlandsNicaraguaNigeriaNorth AmericaNorth MacedoniaNorthern AfricaNorthern EuropeNorwayOceaniaPakistanPanamaPeruPhilippinesPolandPortugalRomaniaRussiaSaudi ArabiaScotlandSenegalSerbiaSierra LeoneSingaporeSomaliaSouth AfricaSouth AmericaSouth Central AsiaSouth Eastern AsiaSouthern EuropeSpainSri LankaSt. Vincent and the GrenadinesSudanSwedenSwitzerlandSyriaTaiwanThailandTrinidad and TobagoTurkeyUgandaUkraineUruguayUzbekistanVenezuelaVietnamWest IndiesWestern AfricaWestern AsiaWestern EuropeYemenZaireZimbabweAzores
Immigrants from Eastern Asia
Race
Ancestry
AfghanAfricanAlaska NativeAlaskan AthabascanAlbanianAleutAlsatianAmericanApacheArabArapahoArgentineanArmenianAssyrian/Chaldean/SyriacAustralianAustrianBahamianBangladeshiBarbadianBasqueBelgianBelizeanBermudanBhutaneseBlackfeetBolivianBrazilianBritishBritish West IndianBulgarianBurmeseCajunCambodianCanadianCape VerdeanCarpatho RusynCelticCentral AmericanCentral American IndianCherokeeCheyenneChickasawChileanChineseChippewaChoctawColombianColvilleComancheCosta RicanCreeCreekCroatianCrowCubanCypriotCzechCzechoslovakianDanishDelawareDominicanDutchDutch West IndianEastern EuropeanEcuadorianEgyptianEnglishEstonianEthiopianEuropeanFijianFilipinoFinnishFrenchFrench American IndianFrench CanadianGermanGerman RussianGhanaianGreekGuamanian/ChamorroGuatemalanGuyaneseHaitianHmongHonduranHopiHoumaHungarianIcelanderIndian (Asian)IndonesianInupiatIranianIraqiIrishIroquoisIsraeliItalianJamaicanJapaneseJordanianKenyanKiowaKoreanLaotianLatvianLebaneseLiberianLithuanianLumbeeLuxembourgerMacedonianMalaysianMalteseMarshalleseMenomineeMexicanMexican American IndianMongolianMoroccanNative HawaiianNavajoNepaleseNew ZealanderNicaraguanNigerianNorthern EuropeanNorwegianOkinawanOsageOttawaPaiutePakistaniPalestinianPanamanianParaguayanPennsylvania GermanPeruvianPimaPolishPortuguesePotawatomiPuebloPuerto RicanPuget Sound SalishRomanianRussianSalvadoranSamoanScandinavianScotch-IrishScottishSeminoleSenegaleseSerbianShoshoneSierra LeoneanSiouxSlavicSlovakSloveneSomaliSouth AfricanSouth AmericanSouth American IndianSoviet UnionSpaniardSpanishSpanish AmericanSpanish American IndianSri LankanSubsaharan AfricanSudaneseSwedishSwissSyrianTaiwaneseThaiTlingit-HaidaTohono O'OdhamTonganTrinidadian and TobagonianTsimshianTurkishU.S. Virgin IslanderUgandanUkrainianUruguayanUteVenezuelanVietnameseWelshWest IndianYakamaYaquiYugoslavianYumanYup'ikZimbabwean
Immigration
NonimmigrantsImmigrantsAfghanistanAfricaAlbaniaArgentinaArmeniaAsiaAustraliaAustriaBahamasBangladeshBarbadosBelarusBelgiumBelizeBoliviaBosnia and HerzegovinaBrazilBulgariaBurma/MyanmarCabo VerdeCambodiaCameroonCanadaCaribbeanCentral AmericaChileChinaColombiaCongoCosta RicaCroatiaCubaCzechoslovakiaDenmarkDominicaDominican RepublicEastern AfricaEastern AsiaEastern EuropeEcuadorEgyptEl SalvadorEnglandEritreaEthiopiaEuropeFijiFranceGermanyGhanaGreeceGrenadaGuatemalaGuyanaHaitiHondurasHong KongHungaryIndiaIndonesiaIranIraqIrelandIsraelItalyJamaicaJapanJordanKazakhstanKenyaKoreaKuwaitLaosLatin AmericaLatviaLebanonLiberiaLithuaniaMalaysiaMexicoMicronesiaMiddle AfricaMoldovaMoroccoNepalNetherlandsNicaraguaNigeriaNorth AmericaNorth MacedoniaNorthern AfricaNorthern EuropeNorwayOceaniaPakistanPanamaPeruPhilippinesPolandPortugalRomaniaRussiaSaudi ArabiaScotlandSenegalSerbiaSierra LeoneSingaporeSomaliaSouth AfricaSouth AmericaSouth Central AsiaSouth Eastern AsiaSouthern EuropeSpainSri LankaSt. Vincent and the GrenadinesSudanSwedenSwitzerlandSyriaTaiwanThailandTurkeyUgandaUkraineUruguayUzbekistanVenezuelaVietnamWest IndiesWestern AfricaWestern AsiaWestern EuropeYemenZaireZimbabweAzores
In Labor Force | Age 35-44
Income
Poverty
Unemployment
Labor Participation
Family Structure
Vehicle Availability
Education Level
Disability

In Labor Force | Age 35-44 Comparison

Immigrants from Trinidad and Tobago

Immigrants from Eastern Asia

Average
Exceptional
84.4%
IN LABOR FORCE | AGE 35-44
50.7/ 100
METRIC RATING
173rd/ 347
METRIC RANK
84.7%
IN LABOR FORCE | AGE 35-44
92.1/ 100
METRIC RATING
118th/ 347
METRIC RANK

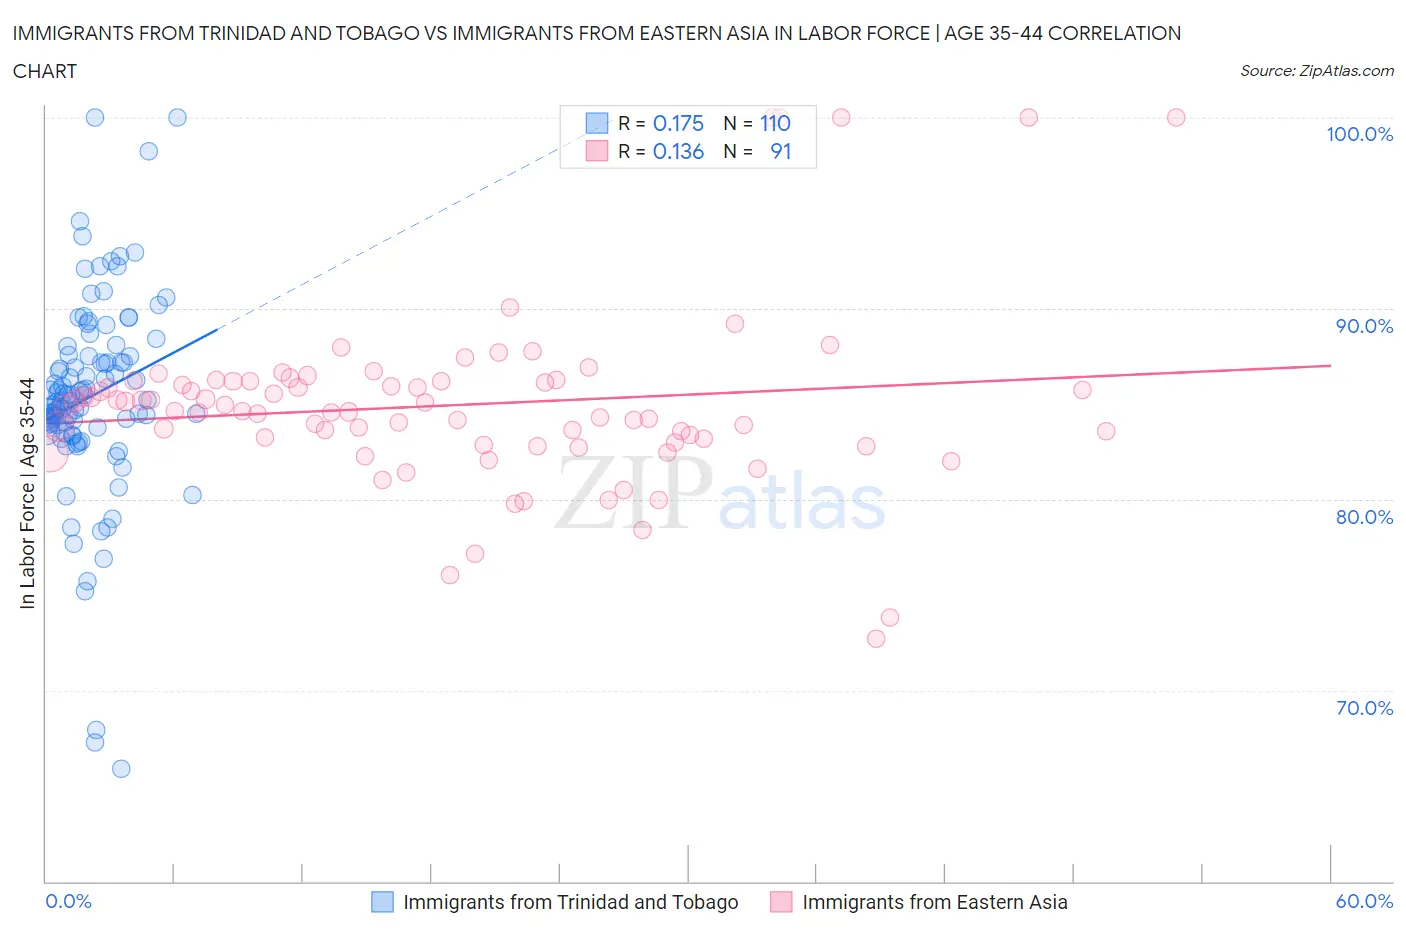
Immigrants from Trinidad and Tobago vs Immigrants from Eastern Asia In Labor Force | Age 35-44 Correlation Chart

The statistical analysis conducted on geographies consisting of 223,496,330 people shows a poor positive correlation between the proportion of Immigrants from Trinidad and Tobago and labor force participation rate among population between the ages 35 and 44 in the United States with a correlation coefficient (R) of 0.175 and weighted average of 84.4%. Similarly, the statistical analysis conducted on geographies consisting of 499,478,449 people shows a poor positive correlation between the proportion of Immigrants from Eastern Asia and labor force participation rate among population between the ages 35 and 44 in the United States with a correlation coefficient (R) of 0.136 and weighted average of 84.7%, a difference of 0.39%.
Immigrants from Trinidad and Tobago vs Immigrants from Eastern Asia In Labor Force | Age 35-44

In Labor Force | Age 35-44 Correlation Summary

MeasurementImmigrants from Trinidad and TobagoImmigrants from Eastern Asia
Minimum65.9%72.7%
Maximum100.0%100.0%
Range34.1%27.3%
Mean85.4%84.9%
Median85.2%84.6%
Interquartile 25% (IQ1)83.8%83.0%
Interquartile 75% (IQ3)87.5%86.2%
Interquartile Range (IQR)3.7%3.2%
Standard Deviation (Sample)5.3%4.7%
Standard Deviation (Population)5.3%4.6%

Similar Demographics by In Labor Force | Age 35-44

Demographics Similar to Immigrants from Trinidad and Tobago by In Labor Force | Age 35-44

In terms of in labor force | age 35-44, the demographic groups most similar to Immigrants from Trinidad and Tobago are Scandinavian (84.4%, a difference of 0.0%), Immigrants from Iran (84.4%, a difference of 0.0%), Immigrants from Afghanistan (84.4%, a difference of 0.010%), Immigrants from Jordan (84.4%, a difference of 0.010%), and Jordanian (84.4%, a difference of 0.010%).
DemographicsRating | RankIn Labor Force | Age 35-44
Alsatians
55.2
/100
|
#166
Average
84.4%
Immigrants | Portugal
55.2
/100
|
#167
Average
84.4%
Irish
53.1
/100
|
#168
Average
84.4%
Immigrants | Afghanistan
52.7
/100
|
#169
Average
84.4%
Immigrants | Jordan
52.5
/100
|
#170
Average
84.4%
Jordanians
51.7
/100
|
#171
Average
84.4%
Scandinavians
51.2
/100
|
#172
Average
84.4%
Immigrants | Trinidad and Tobago
50.7
/100
|
#173
Average
84.4%
Immigrants | Iran
50.0
/100
|
#174
Average
84.4%
Pakistanis
48.2
/100
|
#175
Average
84.4%
Sri Lankans
47.3
/100
|
#176
Average
84.4%
French Canadians
44.3
/100
|
#177
Average
84.3%
Northern Europeans
44.1
/100
|
#178
Average
84.3%
Immigrants | South Africa
42.8
/100
|
#179
Average
84.3%
Danes
38.8
/100
|
#180
Fair
84.3%

Demographics Similar to Immigrants from Eastern Asia by In Labor Force | Age 35-44

In terms of in labor force | age 35-44, the demographic groups most similar to Immigrants from Eastern Asia are Immigrants from China (84.7%, a difference of 0.0%), Immigrants from Egypt (84.7%, a difference of 0.010%), Burmese (84.7%, a difference of 0.010%), Immigrants from Northern Europe (84.7%, a difference of 0.010%), and Finnish (84.7%, a difference of 0.020%).
DemographicsRating | RankIn Labor Force | Age 35-44
Ukrainians
93.5
/100
|
#111
Exceptional
84.7%
Immigrants | Western Africa
93.4
/100
|
#112
Exceptional
84.7%
Uruguayans
93.3
/100
|
#113
Exceptional
84.7%
Chileans
93.2
/100
|
#114
Exceptional
84.7%
Bahamians
93.2
/100
|
#115
Exceptional
84.7%
Immigrants | Egypt
92.7
/100
|
#116
Exceptional
84.7%
Immigrants | China
92.3
/100
|
#117
Exceptional
84.7%
Immigrants | Eastern Asia
92.1
/100
|
#118
Exceptional
84.7%
Burmese
91.8
/100
|
#119
Exceptional
84.7%
Immigrants | Northern Europe
91.5
/100
|
#120
Exceptional
84.7%
Finns
91.2
/100
|
#121
Exceptional
84.7%
Germans
91.0
/100
|
#122
Exceptional
84.7%
Immigrants | South America
90.9
/100
|
#123
Exceptional
84.7%
Slavs
90.8
/100
|
#124
Exceptional
84.7%
Maltese
90.8
/100
|
#125
Exceptional
84.7%