Immigrants from Portugal vs Czechoslovakian In Labor Force | Age 20-24
COMPARE
Immigrants from Portugal
Czechoslovakian
In Labor Force | Age 20-24
In Labor Force | Age 20-24 Comparison
Immigrants from Portugal
Czechoslovakians
75.8%
IN LABOR FORCE | AGE 20-24
94.8/ 100
METRIC RATING
119th/ 347
METRIC RANK
77.5%
IN LABOR FORCE | AGE 20-24
100.0/ 100
METRIC RATING
37th/ 347
METRIC RANK
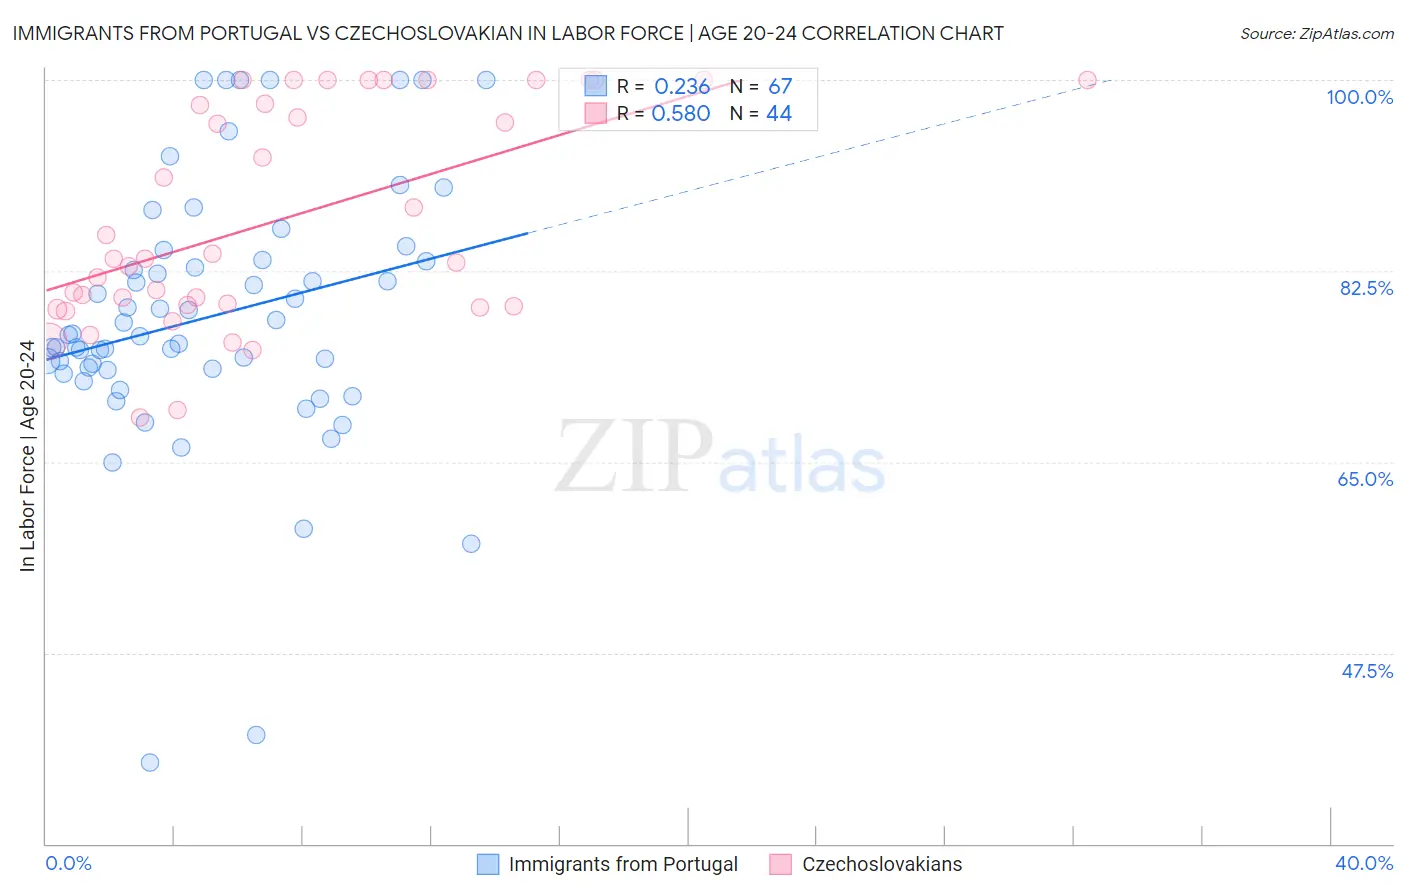
Immigrants from Portugal vs Czechoslovakian In Labor Force | Age 20-24 Correlation Chart
The statistical analysis conducted on geographies consisting of 174,703,744 people shows a weak positive correlation between the proportion of Immigrants from Portugal and labor force participation rate among population between the ages 20 and 24 in the United States with a correlation coefficient (R) of 0.236 and weighted average of 75.8%. Similarly, the statistical analysis conducted on geographies consisting of 368,456,414 people shows a substantial positive correlation between the proportion of Czechoslovakians and labor force participation rate among population between the ages 20 and 24 in the United States with a correlation coefficient (R) of 0.580 and weighted average of 77.5%, a difference of 2.2%.
In Labor Force | Age 20-24 Correlation Summary
| Measurement | Immigrants from Portugal | Czechoslovakian |
| Minimum | 37.5% | 69.1% |
| Maximum | 100.0% | 100.0% |
| Range | 62.5% | 30.9% |
| Mean | 78.3% | 87.3% |
| Median | 76.6% | 83.6% |
| Interquartile 25% (IQ1) | 73.5% | 79.3% |
| Interquartile 75% (IQ3) | 83.6% | 98.9% |
| Interquartile Range (IQR) | 10.1% | 19.6% |
| Standard Deviation (Sample) | 12.1% | 10.0% |
| Standard Deviation (Population) | 12.1% | 9.8% |
Similar Demographics by In Labor Force | Age 20-24
Demographics Similar to Immigrants from Portugal by In Labor Force | Age 20-24
In terms of in labor force | age 20-24, the demographic groups most similar to Immigrants from Portugal are Spanish American (75.8%, a difference of 0.0%), Immigrants from North America (75.9%, a difference of 0.010%), Assyrian/Chaldean/Syriac (75.9%, a difference of 0.010%), Immigrants from Africa (75.8%, a difference of 0.010%), and Immigrants from Zimbabwe (75.9%, a difference of 0.020%).
| Demographics | Rating | Rank | In Labor Force | Age 20-24 |
| Immigrants | Canada | 95.6 /100 | #112 | Exceptional 75.9% |
| Immigrants | Netherlands | 95.3 /100 | #113 | Exceptional 75.9% |
| Immigrants | Zimbabwe | 95.1 /100 | #114 | Exceptional 75.9% |
| Alaska Natives | 95.1 /100 | #115 | Exceptional 75.9% |
| Immigrants | North America | 95.0 /100 | #116 | Exceptional 75.9% |
| Assyrians/Chaldeans/Syriacs | 94.9 /100 | #117 | Exceptional 75.9% |
| Spanish Americans | 94.8 /100 | #118 | Exceptional 75.8% |
| Immigrants | Portugal | 94.8 /100 | #119 | Exceptional 75.8% |
| Immigrants | Africa | 94.6 /100 | #120 | Exceptional 75.8% |
| Immigrants | Serbia | 94.3 /100 | #121 | Exceptional 75.8% |
| Pakistanis | 94.1 /100 | #122 | Exceptional 75.8% |
| Immigrants | Bulgaria | 94.1 /100 | #123 | Exceptional 75.8% |
| Immigrants | Sierra Leone | 93.8 /100 | #124 | Exceptional 75.8% |
| Immigrants | Scotland | 93.7 /100 | #125 | Exceptional 75.8% |
| Brazilians | 93.0 /100 | #126 | Exceptional 75.8% |
Demographics Similar to Czechoslovakians by In Labor Force | Age 20-24
In terms of in labor force | age 20-24, the demographic groups most similar to Czechoslovakians are Welsh (77.5%, a difference of 0.010%), Immigrants from Eastern Africa (77.5%, a difference of 0.030%), Immigrants from Ethiopia (77.5%, a difference of 0.050%), German Russian (77.5%, a difference of 0.050%), and Marshallese (77.4%, a difference of 0.050%).
| Demographics | Rating | Rank | In Labor Force | Age 20-24 |
| Swiss | 100.0 /100 | #30 | Exceptional 77.7% |
| Poles | 100.0 /100 | #31 | Exceptional 77.6% |
| English | 100.0 /100 | #32 | Exceptional 77.6% |
| Immigrants | Ethiopia | 100.0 /100 | #33 | Exceptional 77.5% |
| German Russians | 100.0 /100 | #34 | Exceptional 77.5% |
| Immigrants | Eastern Africa | 100.0 /100 | #35 | Exceptional 77.5% |
| Welsh | 100.0 /100 | #36 | Exceptional 77.5% |
| Czechoslovakians | 100.0 /100 | #37 | Exceptional 77.5% |
| Marshallese | 100.0 /100 | #38 | Exceptional 77.4% |
| Irish | 100.0 /100 | #39 | Exceptional 77.4% |
| Scottish | 100.0 /100 | #40 | Exceptional 77.4% |
| Immigrants | Congo | 100.0 /100 | #41 | Exceptional 77.4% |
| French | 100.0 /100 | #42 | Exceptional 77.4% |
| Immigrants | Laos | 100.0 /100 | #43 | Exceptional 77.4% |
| Fijians | 100.0 /100 | #44 | Exceptional 77.4% |