Immigrants from Spain vs Immigrants from Saudi Arabia In Labor Force | Age > 16
COMPARE
Immigrants from Spain
Immigrants from Saudi Arabia
In Labor Force | Age > 16
In Labor Force | Age > 16 Comparison
Immigrants from Spain
Immigrants from Saudi Arabia
65.8%
IN LABOR FORCE | AGE > 16
98.0/ 100
METRIC RATING
108th/ 347
METRIC RANK
66.3%
IN LABOR FORCE | AGE > 16
99.9/ 100
METRIC RATING
58th/ 347
METRIC RANK
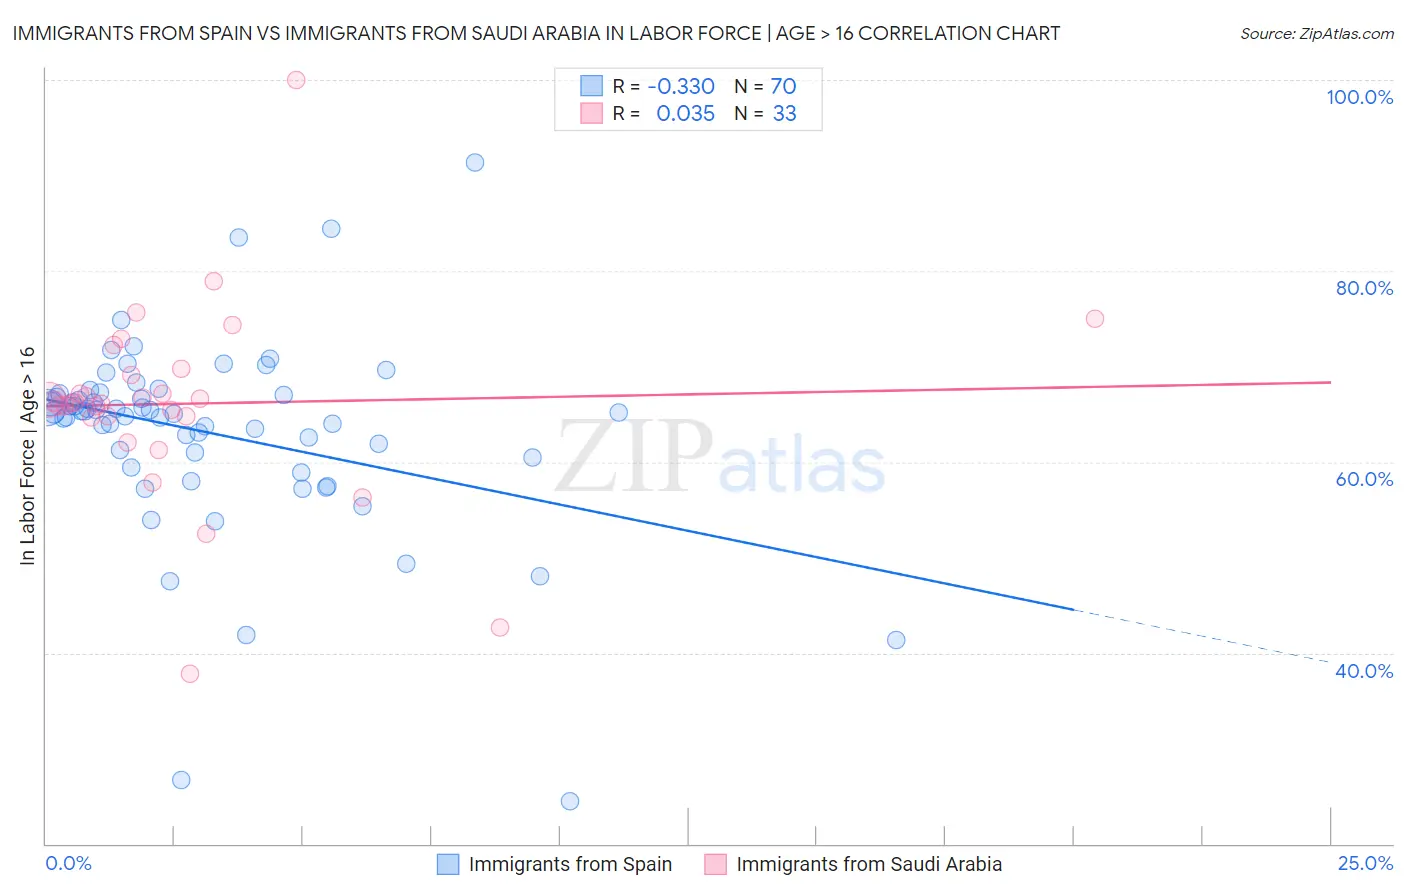
Immigrants from Spain vs Immigrants from Saudi Arabia In Labor Force | Age > 16 Correlation Chart
The statistical analysis conducted on geographies consisting of 239,685,016 people shows a mild negative correlation between the proportion of Immigrants from Spain and labor force participation rate among population ages 16 and over in the United States with a correlation coefficient (R) of -0.330 and weighted average of 65.8%. Similarly, the statistical analysis conducted on geographies consisting of 164,297,187 people shows no correlation between the proportion of Immigrants from Saudi Arabia and labor force participation rate among population ages 16 and over in the United States with a correlation coefficient (R) of 0.035 and weighted average of 66.3%, a difference of 0.76%.
In Labor Force | Age > 16 Correlation Summary
| Measurement | Immigrants from Spain | Immigrants from Saudi Arabia |
| Minimum | 24.5% | 37.8% |
| Maximum | 91.3% | 100.0% |
| Range | 66.8% | 62.2% |
| Mean | 63.0% | 66.1% |
| Median | 65.2% | 66.2% |
| Interquartile 25% (IQ1) | 60.5% | 64.7% |
| Interquartile 75% (IQ3) | 67.0% | 69.4% |
| Interquartile Range (IQR) | 6.5% | 4.7% |
| Standard Deviation (Sample) | 10.3% | 10.3% |
| Standard Deviation (Population) | 10.3% | 10.2% |
Similar Demographics by In Labor Force | Age > 16
Demographics Similar to Immigrants from Spain by In Labor Force | Age > 16
In terms of in labor force | age > 16, the demographic groups most similar to Immigrants from Spain are Immigrants from Japan (65.8%, a difference of 0.0%), Immigrants from Poland (65.8%, a difference of 0.010%), Immigrants from Serbia (65.8%, a difference of 0.020%), Japanese (65.8%, a difference of 0.040%), and Colombian (65.9%, a difference of 0.060%).
| Demographics | Rating | Rank | In Labor Force | Age > 16 |
| Immigrants | Colombia | 98.6 /100 | #101 | Exceptional 65.9% |
| Uruguayans | 98.6 /100 | #102 | Exceptional 65.9% |
| Immigrants | South Eastern Asia | 98.5 /100 | #103 | Exceptional 65.9% |
| Palestinians | 98.5 /100 | #104 | Exceptional 65.9% |
| Colombians | 98.4 /100 | #105 | Exceptional 65.9% |
| Immigrants | Serbia | 98.1 /100 | #106 | Exceptional 65.8% |
| Immigrants | Poland | 98.1 /100 | #107 | Exceptional 65.8% |
| Immigrants | Spain | 98.0 /100 | #108 | Exceptional 65.8% |
| Immigrants | Japan | 98.0 /100 | #109 | Exceptional 65.8% |
| Japanese | 97.7 /100 | #110 | Exceptional 65.8% |
| Immigrants | Honduras | 97.5 /100 | #111 | Exceptional 65.8% |
| Laotians | 97.4 /100 | #112 | Exceptional 65.8% |
| Pakistanis | 97.1 /100 | #113 | Exceptional 65.8% |
| Hondurans | 97.1 /100 | #114 | Exceptional 65.8% |
| Immigrants | Indonesia | 96.8 /100 | #115 | Exceptional 65.7% |
Demographics Similar to Immigrants from Saudi Arabia by In Labor Force | Age > 16
In terms of in labor force | age > 16, the demographic groups most similar to Immigrants from Saudi Arabia are Immigrants from Turkey (66.3%, a difference of 0.020%), Immigrants from Peru (66.3%, a difference of 0.050%), Immigrants from Burma/Myanmar (66.3%, a difference of 0.050%), Indonesian (66.3%, a difference of 0.050%), and Venezuelan (66.3%, a difference of 0.090%).
| Demographics | Rating | Rank | In Labor Force | Age > 16 |
| Immigrants | Kuwait | 100.0 /100 | #51 | Exceptional 66.5% |
| Paraguayans | 99.9 /100 | #52 | Exceptional 66.5% |
| Immigrants | Sri Lanka | 99.9 /100 | #53 | Exceptional 66.5% |
| Immigrants | Bosnia and Herzegovina | 99.9 /100 | #54 | Exceptional 66.5% |
| Immigrants | Venezuela | 99.9 /100 | #55 | Exceptional 66.4% |
| Immigrants | Senegal | 99.9 /100 | #56 | Exceptional 66.4% |
| Bulgarians | 99.9 /100 | #57 | Exceptional 66.4% |
| Immigrants | Saudi Arabia | 99.9 /100 | #58 | Exceptional 66.3% |
| Immigrants | Turkey | 99.9 /100 | #59 | Exceptional 66.3% |
| Immigrants | Peru | 99.8 /100 | #60 | Exceptional 66.3% |
| Immigrants | Burma/Myanmar | 99.8 /100 | #61 | Exceptional 66.3% |
| Indonesians | 99.8 /100 | #62 | Exceptional 66.3% |
| Venezuelans | 99.8 /100 | #63 | Exceptional 66.3% |
| Peruvians | 99.8 /100 | #64 | Exceptional 66.3% |
| Sri Lankans | 99.8 /100 | #65 | Exceptional 66.3% |