Immigrants from Nepal vs Immigrants from Cuba In Labor Force | Age > 16
COMPARE
Immigrants from Nepal
Immigrants from Cuba
In Labor Force | Age > 16
In Labor Force | Age > 16 Comparison
Immigrants from Nepal
Immigrants from Cuba
68.0%
IN LABOR FORCE | AGE > 16
100.0/ 100
METRIC RATING
13th/ 347
METRIC RANK
64.1%
IN LABOR FORCE | AGE > 16
0.3/ 100
METRIC RATING
274th/ 347
METRIC RANK
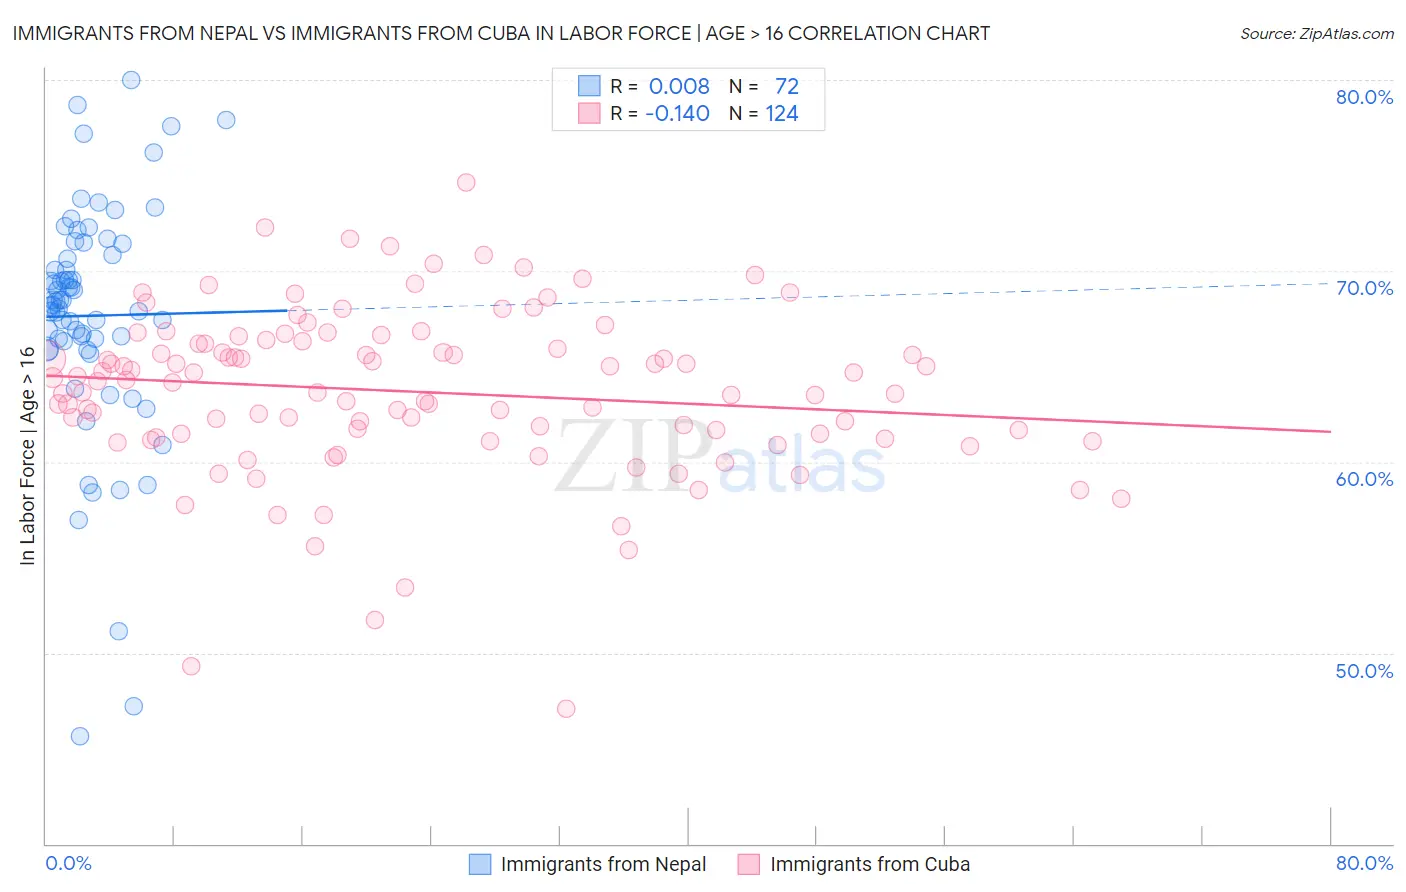
Immigrants from Nepal vs Immigrants from Cuba In Labor Force | Age > 16 Correlation Chart
The statistical analysis conducted on geographies consisting of 186,792,250 people shows no correlation between the proportion of Immigrants from Nepal and labor force participation rate among population ages 16 and over in the United States with a correlation coefficient (R) of 0.008 and weighted average of 68.0%. Similarly, the statistical analysis conducted on geographies consisting of 326,010,342 people shows a poor negative correlation between the proportion of Immigrants from Cuba and labor force participation rate among population ages 16 and over in the United States with a correlation coefficient (R) of -0.140 and weighted average of 64.1%, a difference of 6.2%.
In Labor Force | Age > 16 Correlation Summary
| Measurement | Immigrants from Nepal | Immigrants from Cuba |
| Minimum | 45.6% | 47.1% |
| Maximum | 80.0% | 74.6% |
| Range | 34.4% | 27.5% |
| Mean | 67.7% | 63.7% |
| Median | 68.3% | 64.2% |
| Interquartile 25% (IQ1) | 66.1% | 61.4% |
| Interquartile 75% (IQ3) | 71.1% | 66.3% |
| Interquartile Range (IQR) | 5.0% | 4.9% |
| Standard Deviation (Sample) | 6.3% | 4.4% |
| Standard Deviation (Population) | 6.2% | 4.4% |
Similar Demographics by In Labor Force | Age > 16
Demographics Similar to Immigrants from Nepal by In Labor Force | Age > 16
In terms of in labor force | age > 16, the demographic groups most similar to Immigrants from Nepal are Sudanese (68.0%, a difference of 0.020%), Bolivian (68.2%, a difference of 0.24%), Liberian (67.8%, a difference of 0.36%), Immigrants from Middle Africa (67.7%, a difference of 0.42%), and Immigrants from Sudan (67.7%, a difference of 0.53%).
| Demographics | Rating | Rank | In Labor Force | Age > 16 |
| Immigrants | Eritrea | 100.0 /100 | #6 | Exceptional 68.9% |
| Immigrants | Cameroon | 100.0 /100 | #7 | Exceptional 68.7% |
| Immigrants | Sierra Leone | 100.0 /100 | #8 | Exceptional 68.5% |
| Immigrants | Eastern Africa | 100.0 /100 | #9 | Exceptional 68.5% |
| Immigrants | Bolivia | 100.0 /100 | #10 | Exceptional 68.4% |
| Bolivians | 100.0 /100 | #11 | Exceptional 68.2% |
| Sudanese | 100.0 /100 | #12 | Exceptional 68.0% |
| Immigrants | Nepal | 100.0 /100 | #13 | Exceptional 68.0% |
| Liberians | 100.0 /100 | #14 | Exceptional 67.8% |
| Immigrants | Middle Africa | 100.0 /100 | #15 | Exceptional 67.7% |
| Immigrants | Sudan | 100.0 /100 | #16 | Exceptional 67.7% |
| Immigrants | India | 100.0 /100 | #17 | Exceptional 67.6% |
| Immigrants | Liberia | 100.0 /100 | #18 | Exceptional 67.6% |
| Kenyans | 100.0 /100 | #19 | Exceptional 67.6% |
| Immigrants | Kenya | 100.0 /100 | #20 | Exceptional 67.6% |
Demographics Similar to Immigrants from Cuba by In Labor Force | Age > 16
In terms of in labor force | age > 16, the demographic groups most similar to Immigrants from Cuba are Mexican (64.1%, a difference of 0.0%), French American Indian (64.1%, a difference of 0.0%), Native Hawaiian (64.1%, a difference of 0.020%), Hmong (64.1%, a difference of 0.020%), and Immigrants from Bahamas (64.0%, a difference of 0.030%).
| Demographics | Rating | Rank | In Labor Force | Age > 16 |
| Canadians | 0.5 /100 | #267 | Tragic 64.1% |
| Spaniards | 0.5 /100 | #268 | Tragic 64.1% |
| Irish | 0.4 /100 | #269 | Tragic 64.1% |
| Guyanese | 0.4 /100 | #270 | Tragic 64.1% |
| Dominicans | 0.4 /100 | #271 | Tragic 64.1% |
| Native Hawaiians | 0.3 /100 | #272 | Tragic 64.1% |
| Hmong | 0.3 /100 | #273 | Tragic 64.1% |
| Immigrants | Cuba | 0.3 /100 | #274 | Tragic 64.1% |
| Mexicans | 0.3 /100 | #275 | Tragic 64.1% |
| French American Indians | 0.3 /100 | #276 | Tragic 64.1% |
| Immigrants | Bahamas | 0.3 /100 | #277 | Tragic 64.0% |
| Assyrians/Chaldeans/Syriacs | 0.3 /100 | #278 | Tragic 64.0% |
| Welsh | 0.2 /100 | #279 | Tragic 64.0% |
| Immigrants | St. Vincent and the Grenadines | 0.2 /100 | #280 | Tragic 64.0% |
| French Canadians | 0.2 /100 | #281 | Tragic 64.0% |