Immigrants from Costa Rica vs Immigrants from Sweden In Labor Force | Age 20-64
COMPARE
Immigrants from Costa Rica
Immigrants from Sweden
In Labor Force | Age 20-64
In Labor Force | Age 20-64 Comparison
Immigrants from Costa Rica
Immigrants from Sweden
79.7%
IN LABOR FORCE | AGE 20-64
64.6/ 100
METRIC RATING
163rd/ 347
METRIC RANK
79.8%
IN LABOR FORCE | AGE 20-64
79.7/ 100
METRIC RATING
143rd/ 347
METRIC RANK
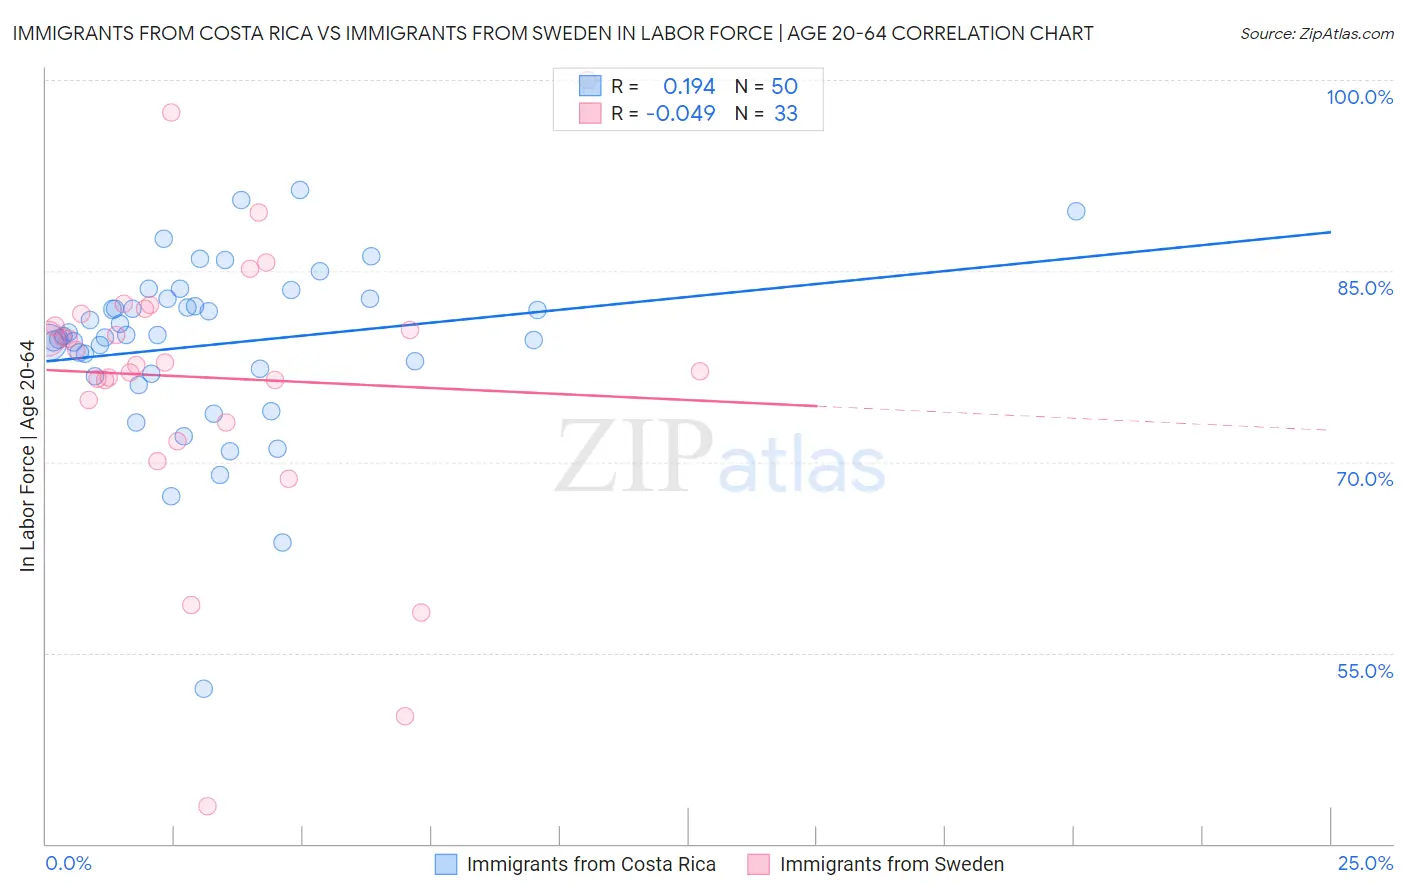
Immigrants from Costa Rica vs Immigrants from Sweden In Labor Force | Age 20-64 Correlation Chart
The statistical analysis conducted on geographies consisting of 204,275,671 people shows a poor positive correlation between the proportion of Immigrants from Costa Rica and labor force participation rate among population between the ages 20 and 64 in the United States with a correlation coefficient (R) of 0.194 and weighted average of 79.7%. Similarly, the statistical analysis conducted on geographies consisting of 164,749,668 people shows no correlation between the proportion of Immigrants from Sweden and labor force participation rate among population between the ages 20 and 64 in the United States with a correlation coefficient (R) of -0.049 and weighted average of 79.8%, a difference of 0.15%.
In Labor Force | Age 20-64 Correlation Summary
| Measurement | Immigrants from Costa Rica | Immigrants from Sweden |
| Minimum | 52.2% | 42.9% |
| Maximum | 91.4% | 100.0% |
| Range | 39.2% | 57.1% |
| Mean | 79.2% | 76.6% |
| Median | 80.0% | 77.8% |
| Interquartile 25% (IQ1) | 76.9% | 74.0% |
| Interquartile 75% (IQ3) | 82.8% | 81.8% |
| Interquartile Range (IQR) | 5.9% | 7.8% |
| Standard Deviation (Sample) | 6.9% | 11.4% |
| Standard Deviation (Population) | 6.8% | 11.2% |
Demographics Similar to Immigrants from Costa Rica and Immigrants from Sweden by In Labor Force | Age 20-64
In terms of in labor force | age 20-64, the demographic groups most similar to Immigrants from Costa Rica are South African (79.7%, a difference of 0.010%), German (79.7%, a difference of 0.010%), Immigrants from Cuba (79.7%, a difference of 0.020%), Moroccan (79.7%, a difference of 0.020%), and Austrian (79.7%, a difference of 0.030%). Similarly, the demographic groups most similar to Immigrants from Sweden are Korean (79.8%, a difference of 0.0%), Pakistani (79.8%, a difference of 0.010%), Immigrants from Southern Europe (79.8%, a difference of 0.010%), Immigrants from Philippines (79.8%, a difference of 0.020%), and Romanian (79.8%, a difference of 0.030%).
| Demographics | Rating | Rank | In Labor Force | Age 20-64 |
| Immigrants | Sweden | 79.7 /100 | #143 | Good 79.8% |
| Koreans | 79.6 /100 | #144 | Good 79.8% |
| Pakistanis | 79.3 /100 | #145 | Good 79.8% |
| Immigrants | Southern Europe | 78.9 /100 | #146 | Good 79.8% |
| Immigrants | Philippines | 78.0 /100 | #147 | Good 79.8% |
| Romanians | 77.6 /100 | #148 | Good 79.8% |
| Icelanders | 75.1 /100 | #149 | Good 79.7% |
| Costa Ricans | 72.4 /100 | #150 | Good 79.7% |
| Scandinavians | 72.0 /100 | #151 | Good 79.7% |
| Immigrants | Northern Europe | 72.0 /100 | #152 | Good 79.7% |
| Immigrants | Kazakhstan | 69.5 /100 | #153 | Good 79.7% |
| New Zealanders | 69.4 /100 | #154 | Good 79.7% |
| Immigrants | South Africa | 69.2 /100 | #155 | Good 79.7% |
| Senegalese | 69.1 /100 | #156 | Good 79.7% |
| Immigrants | China | 69.1 /100 | #157 | Good 79.7% |
| Austrians | 67.6 /100 | #158 | Good 79.7% |
| Immigrants | Cuba | 66.7 /100 | #159 | Good 79.7% |
| Moroccans | 66.7 /100 | #160 | Good 79.7% |
| South Africans | 66.2 /100 | #161 | Good 79.7% |
| Germans | 65.2 /100 | #162 | Good 79.7% |
| Immigrants | Costa Rica | 64.6 /100 | #163 | Good 79.7% |