Dominican vs Paraguayan In Labor Force | Age 20-24
COMPARE
Dominican
Paraguayan
In Labor Force | Age 20-24
In Labor Force | Age 20-24 Comparison
Dominicans
Paraguayans
71.1%
IN LABOR FORCE | AGE 20-24
0.0/ 100
METRIC RATING
326th/ 347
METRIC RANK
73.7%
IN LABOR FORCE | AGE 20-24
0.8/ 100
METRIC RATING
257th/ 347
METRIC RANK
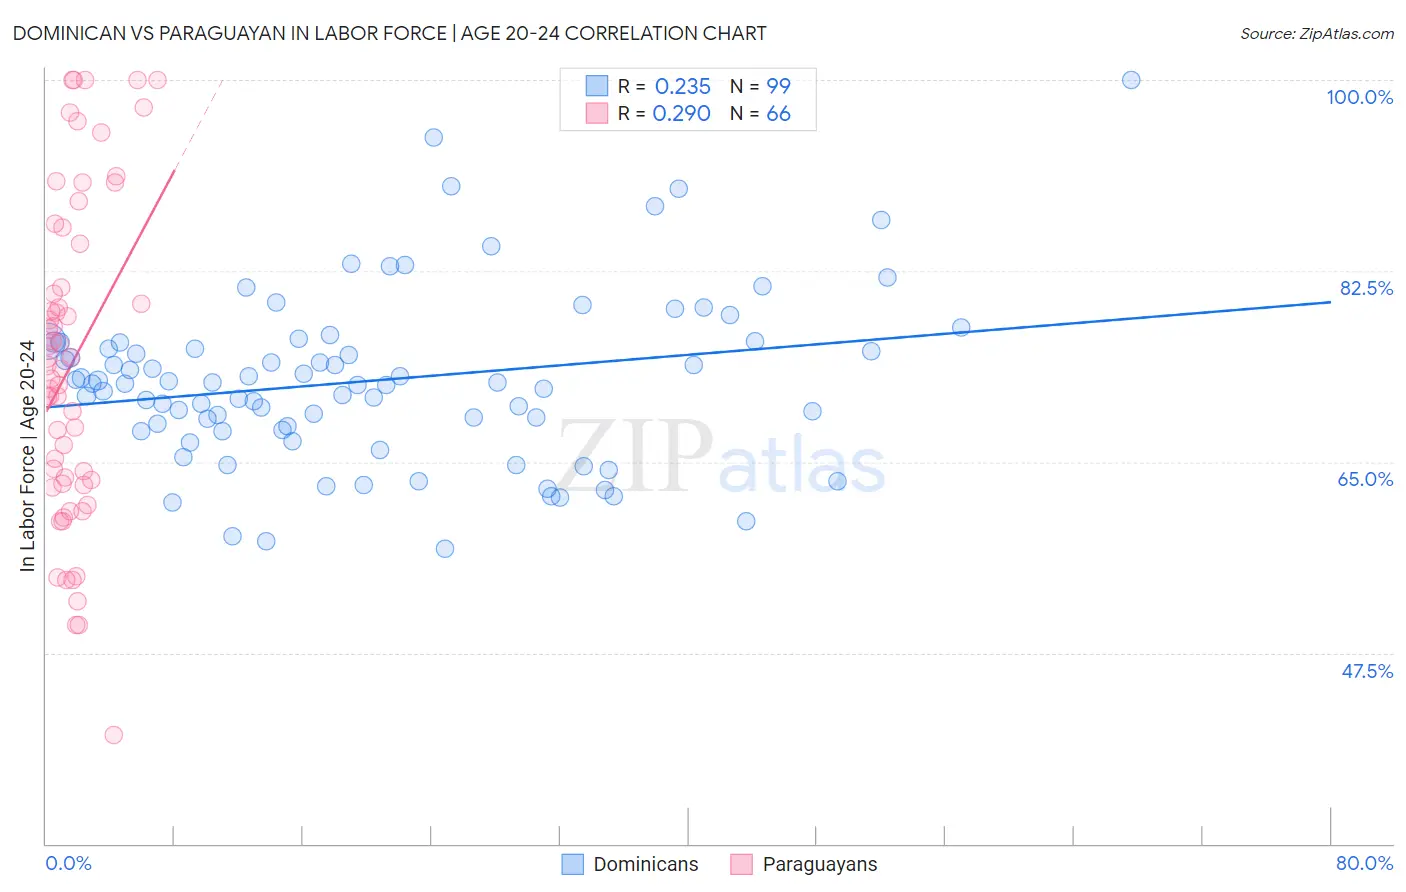
Dominican vs Paraguayan In Labor Force | Age 20-24 Correlation Chart
The statistical analysis conducted on geographies consisting of 355,092,394 people shows a weak positive correlation between the proportion of Dominicans and labor force participation rate among population between the ages 20 and 24 in the United States with a correlation coefficient (R) of 0.235 and weighted average of 71.1%. Similarly, the statistical analysis conducted on geographies consisting of 95,113,378 people shows a weak positive correlation between the proportion of Paraguayans and labor force participation rate among population between the ages 20 and 24 in the United States with a correlation coefficient (R) of 0.290 and weighted average of 73.7%, a difference of 3.7%.
In Labor Force | Age 20-24 Correlation Summary
| Measurement | Dominican | Paraguayan |
| Minimum | 57.1% | 40.0% |
| Maximum | 100.0% | 100.0% |
| Range | 42.9% | 60.0% |
| Mean | 72.4% | 74.1% |
| Median | 72.2% | 73.7% |
| Interquartile 25% (IQ1) | 67.9% | 63.0% |
| Interquartile 75% (IQ3) | 76.0% | 85.0% |
| Interquartile Range (IQR) | 8.1% | 22.0% |
| Standard Deviation (Sample) | 7.8% | 14.7% |
| Standard Deviation (Population) | 7.7% | 14.6% |
Similar Demographics by In Labor Force | Age 20-24
Demographics Similar to Dominicans by In Labor Force | Age 20-24
In terms of in labor force | age 20-24, the demographic groups most similar to Dominicans are Immigrants from Trinidad and Tobago (71.1%, a difference of 0.0%), Immigrants from China (71.1%, a difference of 0.020%), Barbadian (71.1%, a difference of 0.080%), Immigrants from Dominican Republic (71.2%, a difference of 0.19%), and Yup'ik (70.9%, a difference of 0.26%).
| Demographics | Rating | Rank | In Labor Force | Age 20-24 |
| Immigrants | Israel | 0.0 /100 | #319 | Tragic 71.6% |
| Trinidadians and Tobagonians | 0.0 /100 | #320 | Tragic 71.5% |
| Immigrants | Taiwan | 0.0 /100 | #321 | Tragic 71.5% |
| Filipinos | 0.0 /100 | #322 | Tragic 71.4% |
| West Indians | 0.0 /100 | #323 | Tragic 71.3% |
| Immigrants | Dominican Republic | 0.0 /100 | #324 | Tragic 71.2% |
| Barbadians | 0.0 /100 | #325 | Tragic 71.1% |
| Dominicans | 0.0 /100 | #326 | Tragic 71.1% |
| Immigrants | Trinidad and Tobago | 0.0 /100 | #327 | Tragic 71.1% |
| Immigrants | China | 0.0 /100 | #328 | Tragic 71.1% |
| Yup'ik | 0.0 /100 | #329 | Tragic 70.9% |
| Vietnamese | 0.0 /100 | #330 | Tragic 70.6% |
| Immigrants | Bangladesh | 0.0 /100 | #331 | Tragic 70.6% |
| Immigrants | Uzbekistan | 0.0 /100 | #332 | Tragic 70.4% |
| Yuman | 0.0 /100 | #333 | Tragic 70.3% |
Demographics Similar to Paraguayans by In Labor Force | Age 20-24
In terms of in labor force | age 20-24, the demographic groups most similar to Paraguayans are Spanish American Indian (73.7%, a difference of 0.020%), Egyptian (73.7%, a difference of 0.040%), Dutch West Indian (73.7%, a difference of 0.040%), Immigrants from Pakistan (73.8%, a difference of 0.060%), and Immigrants from Turkey (73.7%, a difference of 0.070%).
| Demographics | Rating | Rank | In Labor Force | Age 20-24 |
| Immigrants | Belgium | 1.3 /100 | #250 | Tragic 73.9% |
| Immigrants | Egypt | 1.2 /100 | #251 | Tragic 73.8% |
| Immigrants | Kazakhstan | 1.1 /100 | #252 | Tragic 73.8% |
| Arapaho | 1.0 /100 | #253 | Tragic 73.8% |
| Ute | 1.0 /100 | #254 | Tragic 73.8% |
| Immigrants | Pakistan | 0.9 /100 | #255 | Tragic 73.8% |
| Spanish American Indians | 0.8 /100 | #256 | Tragic 73.7% |
| Paraguayans | 0.8 /100 | #257 | Tragic 73.7% |
| Egyptians | 0.7 /100 | #258 | Tragic 73.7% |
| Dutch West Indians | 0.7 /100 | #259 | Tragic 73.7% |
| Immigrants | Turkey | 0.7 /100 | #260 | Tragic 73.7% |
| Houma | 0.6 /100 | #261 | Tragic 73.7% |
| Asians | 0.6 /100 | #262 | Tragic 73.7% |
| Immigrants | Asia | 0.5 /100 | #263 | Tragic 73.6% |
| Immigrants | Haiti | 0.5 /100 | #264 | Tragic 73.6% |