Immigrants from Somalia vs Ghanaian In Labor Force | Age 25-29
COMPARE
Immigrants from Somalia
Ghanaian
In Labor Force | Age 25-29
In Labor Force | Age 25-29 Comparison
Immigrants from Somalia
Ghanaians
87.1%
IN LABOR FORCE | AGE 25-29
100.0/ 100
METRIC RATING
2nd/ 347
METRIC RANK
84.7%
IN LABOR FORCE | AGE 25-29
57.6/ 100
METRIC RATING
164th/ 347
METRIC RANK
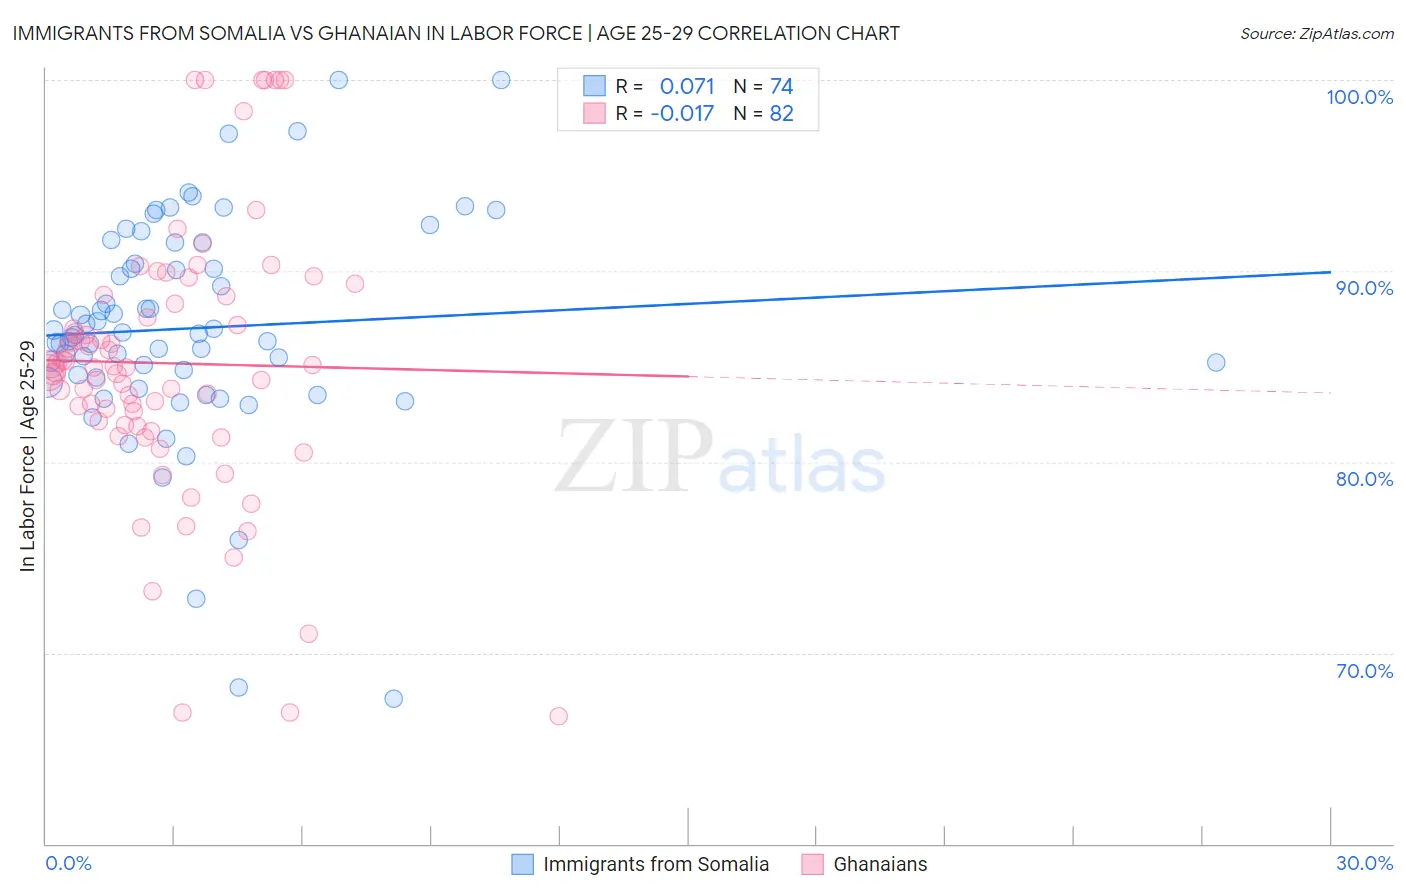
Immigrants from Somalia vs Ghanaian In Labor Force | Age 25-29 Correlation Chart
The statistical analysis conducted on geographies consisting of 92,105,545 people shows a slight positive correlation between the proportion of Immigrants from Somalia and labor force participation rate among population between the ages 25 and 29 in the United States with a correlation coefficient (R) of 0.071 and weighted average of 87.1%. Similarly, the statistical analysis conducted on geographies consisting of 190,676,987 people shows no correlation between the proportion of Ghanaians and labor force participation rate among population between the ages 25 and 29 in the United States with a correlation coefficient (R) of -0.017 and weighted average of 84.7%, a difference of 2.8%.
In Labor Force | Age 25-29 Correlation Summary
| Measurement | Immigrants from Somalia | Ghanaian |
| Minimum | 67.6% | 66.7% |
| Maximum | 100.0% | 100.0% |
| Range | 32.4% | 33.3% |
| Mean | 87.0% | 85.2% |
| Median | 86.7% | 84.9% |
| Interquartile 25% (IQ1) | 84.4% | 81.9% |
| Interquartile 75% (IQ3) | 90.4% | 88.7% |
| Interquartile Range (IQR) | 5.9% | 6.8% |
| Standard Deviation (Sample) | 5.8% | 7.1% |
| Standard Deviation (Population) | 5.8% | 7.1% |
Similar Demographics by In Labor Force | Age 25-29
Demographics Similar to Immigrants from Somalia by In Labor Force | Age 25-29
In terms of in labor force | age 25-29, the demographic groups most similar to Immigrants from Somalia are Somali (87.1%, a difference of 0.010%), Carpatho Rusyn (87.0%, a difference of 0.090%), Luxembourger (86.9%, a difference of 0.19%), Slovene (86.4%, a difference of 0.81%), and Immigrants from Bosnia and Herzegovina (86.3%, a difference of 0.93%).
| Demographics | Rating | Rank | In Labor Force | Age 25-29 |
| Tsimshian | 100.0 /100 | #1 | Exceptional 88.7% |
| Immigrants | Somalia | 100.0 /100 | #2 | Exceptional 87.1% |
| Somalis | 100.0 /100 | #3 | Exceptional 87.1% |
| Carpatho Rusyns | 100.0 /100 | #4 | Exceptional 87.0% |
| Luxembourgers | 100.0 /100 | #5 | Exceptional 86.9% |
| Slovenes | 100.0 /100 | #6 | Exceptional 86.4% |
| Immigrants | Bosnia and Herzegovina | 100.0 /100 | #7 | Exceptional 86.3% |
| Immigrants | Cabo Verde | 100.0 /100 | #8 | Exceptional 86.2% |
| Ethiopians | 100.0 /100 | #9 | Exceptional 86.2% |
| Liberians | 100.0 /100 | #10 | Exceptional 86.1% |
| Immigrants | Ethiopia | 100.0 /100 | #11 | Exceptional 86.1% |
| Immigrants | Lithuania | 100.0 /100 | #12 | Exceptional 86.1% |
| Norwegians | 100.0 /100 | #13 | Exceptional 86.1% |
| Latvians | 100.0 /100 | #14 | Exceptional 86.1% |
| Bolivians | 100.0 /100 | #15 | Exceptional 86.1% |
Demographics Similar to Ghanaians by In Labor Force | Age 25-29
In terms of in labor force | age 25-29, the demographic groups most similar to Ghanaians are Immigrants from Colombia (84.7%, a difference of 0.0%), Argentinean (84.7%, a difference of 0.0%), Immigrants from Burma/Myanmar (84.7%, a difference of 0.0%), Immigrants from Peru (84.7%, a difference of 0.010%), and Canadian (84.7%, a difference of 0.010%).
| Demographics | Rating | Rank | In Labor Force | Age 25-29 |
| British | 60.4 /100 | #157 | Good 84.7% |
| Immigrants | Ghana | 60.2 /100 | #158 | Good 84.7% |
| Immigrants | Western Africa | 60.1 /100 | #159 | Good 84.7% |
| Immigrants | Peru | 58.6 /100 | #160 | Average 84.7% |
| Canadians | 58.5 /100 | #161 | Average 84.7% |
| Immigrants | Colombia | 58.3 /100 | #162 | Average 84.7% |
| Argentineans | 57.9 /100 | #163 | Average 84.7% |
| Ghanaians | 57.6 /100 | #164 | Average 84.7% |
| Immigrants | Burma/Myanmar | 57.4 /100 | #165 | Average 84.7% |
| Immigrants | Spain | 56.9 /100 | #166 | Average 84.7% |
| Indonesians | 56.5 /100 | #167 | Average 84.7% |
| South Americans | 54.9 /100 | #168 | Average 84.7% |
| Celtics | 52.5 /100 | #169 | Average 84.7% |
| Tongans | 52.4 /100 | #170 | Average 84.7% |
| Immigrants | Vietnam | 50.5 /100 | #171 | Average 84.7% |