Immigrants from Sierra Leone vs German In Labor Force | Age 20-64
COMPARE
Immigrants from Sierra Leone
German
In Labor Force | Age 20-64
In Labor Force | Age 20-64 Comparison
Immigrants from Sierra Leone
Germans
81.5%
IN LABOR FORCE | AGE 20-64
100.0/ 100
METRIC RATING
10th/ 347
METRIC RANK
79.7%
IN LABOR FORCE | AGE 20-64
65.2/ 100
METRIC RATING
162nd/ 347
METRIC RANK
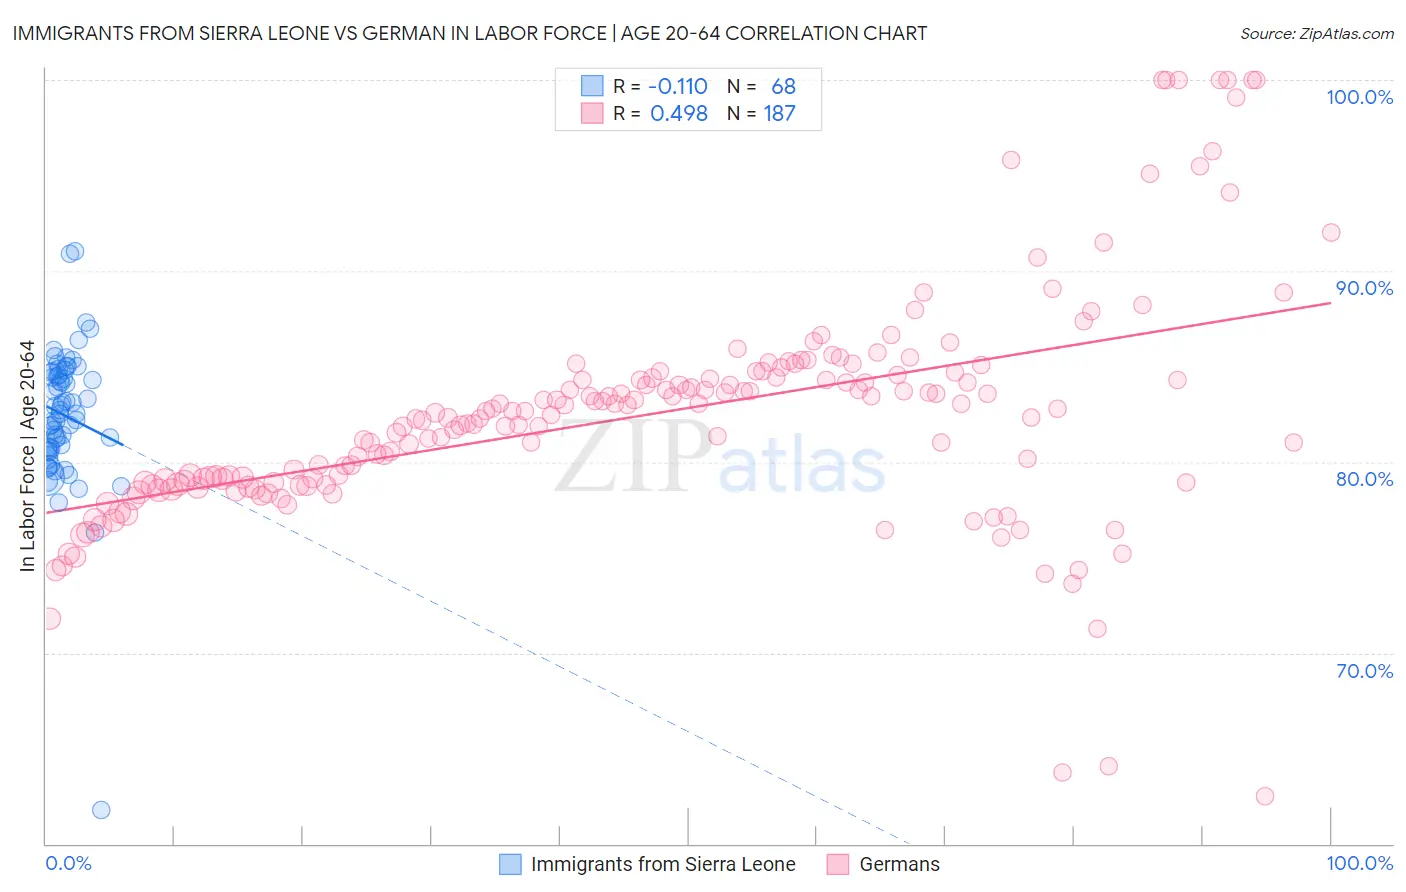
Immigrants from Sierra Leone vs German In Labor Force | Age 20-64 Correlation Chart
The statistical analysis conducted on geographies consisting of 101,646,637 people shows a poor negative correlation between the proportion of Immigrants from Sierra Leone and labor force participation rate among population between the ages 20 and 64 in the United States with a correlation coefficient (R) of -0.110 and weighted average of 81.5%. Similarly, the statistical analysis conducted on geographies consisting of 581,278,345 people shows a moderate positive correlation between the proportion of Germans and labor force participation rate among population between the ages 20 and 64 in the United States with a correlation coefficient (R) of 0.498 and weighted average of 79.7%, a difference of 2.2%.
In Labor Force | Age 20-64 Correlation Summary
| Measurement | Immigrants from Sierra Leone | German |
| Minimum | 61.8% | 62.5% |
| Maximum | 91.0% | 100.0% |
| Range | 29.2% | 37.5% |
| Mean | 82.4% | 82.5% |
| Median | 82.6% | 82.6% |
| Interquartile 25% (IQ1) | 80.7% | 78.9% |
| Interquartile 75% (IQ3) | 84.6% | 84.4% |
| Interquartile Range (IQR) | 3.9% | 5.5% |
| Standard Deviation (Sample) | 3.8% | 6.1% |
| Standard Deviation (Population) | 3.7% | 6.1% |
Similar Demographics by In Labor Force | Age 20-64
Demographics Similar to Immigrants from Sierra Leone by In Labor Force | Age 20-64
In terms of in labor force | age 20-64, the demographic groups most similar to Immigrants from Sierra Leone are Immigrants from Somalia (81.6%, a difference of 0.12%), Sierra Leonean (81.5%, a difference of 0.12%), Immigrants from Cameroon (81.6%, a difference of 0.14%), Somali (81.6%, a difference of 0.18%), and Immigrants from Eastern Africa (81.3%, a difference of 0.18%).
| Demographics | Rating | Rank | In Labor Force | Age 20-64 |
| Immigrants | Bolivia | 100.0 /100 | #3 | Exceptional 81.9% |
| Luxembourgers | 100.0 /100 | #4 | Exceptional 81.9% |
| Bolivians | 100.0 /100 | #5 | Exceptional 81.7% |
| Somalis | 100.0 /100 | #6 | Exceptional 81.6% |
| Immigrants | Cameroon | 100.0 /100 | #7 | Exceptional 81.6% |
| Immigrants | Somalia | 100.0 /100 | #8 | Exceptional 81.6% |
| Sierra Leoneans | 100.0 /100 | #9 | Exceptional 81.5% |
| Immigrants | Sierra Leone | 100.0 /100 | #10 | Exceptional 81.5% |
| Immigrants | Eastern Africa | 100.0 /100 | #11 | Exceptional 81.3% |
| Immigrants | Eritrea | 100.0 /100 | #12 | Exceptional 81.3% |
| Immigrants | India | 100.0 /100 | #13 | Exceptional 81.3% |
| Cambodians | 100.0 /100 | #14 | Exceptional 81.1% |
| Bulgarians | 100.0 /100 | #15 | Exceptional 81.1% |
| Immigrants | Nepal | 100.0 /100 | #16 | Exceptional 81.1% |
| Norwegians | 100.0 /100 | #17 | Exceptional 81.0% |
Demographics Similar to Germans by In Labor Force | Age 20-64
In terms of in labor force | age 20-64, the demographic groups most similar to Germans are Immigrants from Cuba (79.7%, a difference of 0.010%), Moroccan (79.7%, a difference of 0.010%), South African (79.7%, a difference of 0.010%), Immigrants from Costa Rica (79.7%, a difference of 0.010%), and Immigrants from Burma/Myanmar (79.7%, a difference of 0.010%).
| Demographics | Rating | Rank | In Labor Force | Age 20-64 |
| Immigrants | South Africa | 69.2 /100 | #155 | Good 79.7% |
| Senegalese | 69.1 /100 | #156 | Good 79.7% |
| Immigrants | China | 69.1 /100 | #157 | Good 79.7% |
| Austrians | 67.6 /100 | #158 | Good 79.7% |
| Immigrants | Cuba | 66.7 /100 | #159 | Good 79.7% |
| Moroccans | 66.7 /100 | #160 | Good 79.7% |
| South Africans | 66.2 /100 | #161 | Good 79.7% |
| Germans | 65.2 /100 | #162 | Good 79.7% |
| Immigrants | Costa Rica | 64.6 /100 | #163 | Good 79.7% |
| Immigrants | Burma/Myanmar | 64.4 /100 | #164 | Good 79.7% |
| Nigerians | 64.0 /100 | #165 | Good 79.7% |
| Okinawans | 62.7 /100 | #166 | Good 79.6% |
| Immigrants | Iraq | 62.0 /100 | #167 | Good 79.6% |
| Immigrants | Indonesia | 61.8 /100 | #168 | Good 79.6% |
| Laotians | 58.4 /100 | #169 | Average 79.6% |