Immigrants from Sierra Leone vs Bolivian In Labor Force | Age 25-29
COMPARE
Immigrants from Sierra Leone
Bolivian
In Labor Force | Age 25-29
In Labor Force | Age 25-29 Comparison
Immigrants from Sierra Leone
Bolivians
85.7%
IN LABOR FORCE | AGE 25-29
99.9/ 100
METRIC RATING
45th/ 347
METRIC RANK
86.1%
IN LABOR FORCE | AGE 25-29
100.0/ 100
METRIC RATING
15th/ 347
METRIC RANK
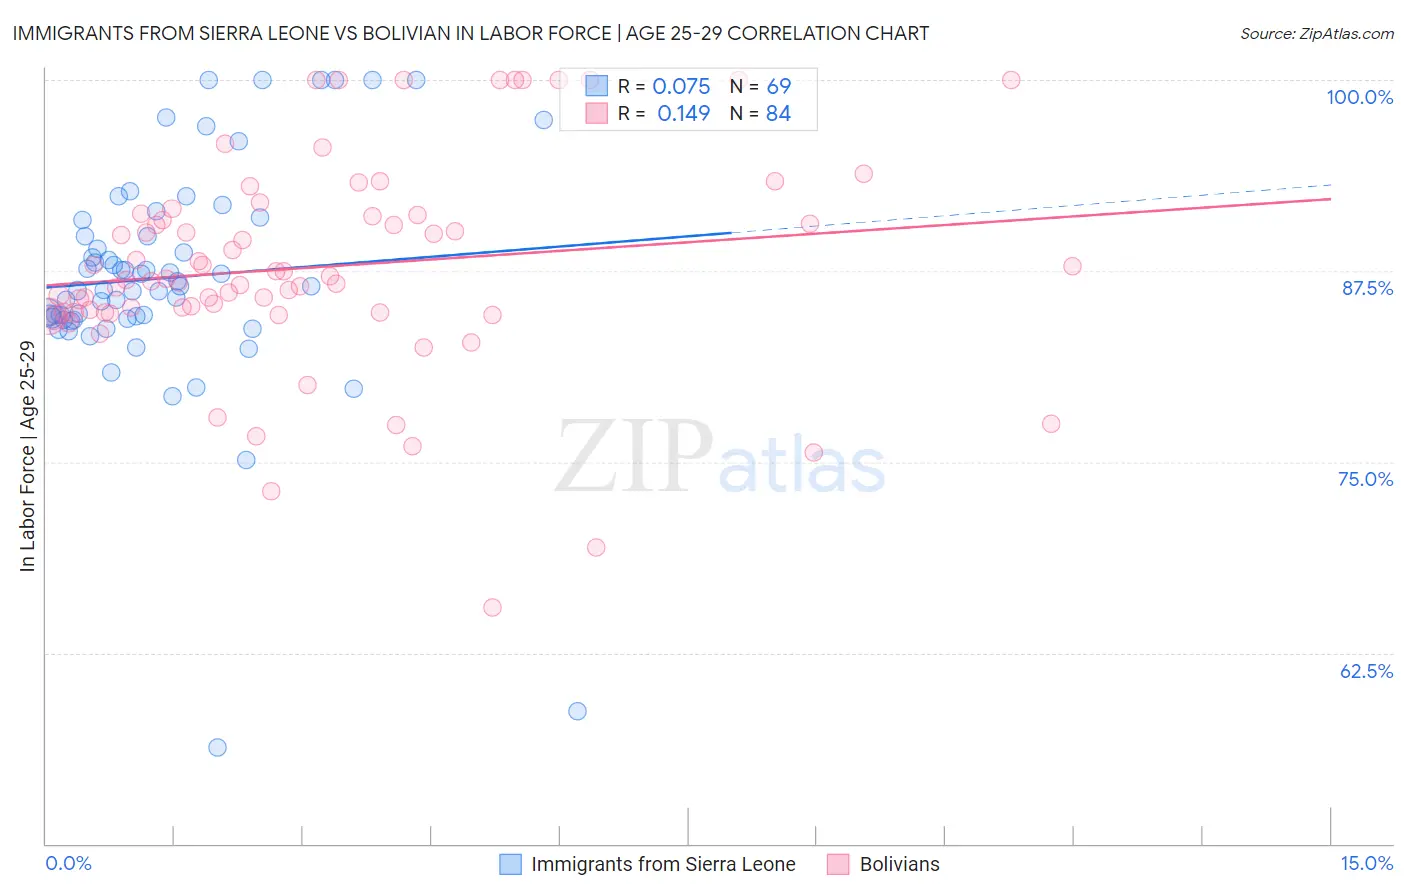
Immigrants from Sierra Leone vs Bolivian In Labor Force | Age 25-29 Correlation Chart
The statistical analysis conducted on geographies consisting of 101,649,226 people shows a slight positive correlation between the proportion of Immigrants from Sierra Leone and labor force participation rate among population between the ages 25 and 29 in the United States with a correlation coefficient (R) of 0.075 and weighted average of 85.7%. Similarly, the statistical analysis conducted on geographies consisting of 184,657,655 people shows a poor positive correlation between the proportion of Bolivians and labor force participation rate among population between the ages 25 and 29 in the United States with a correlation coefficient (R) of 0.149 and weighted average of 86.1%, a difference of 0.48%.
In Labor Force | Age 25-29 Correlation Summary
| Measurement | Immigrants from Sierra Leone | Bolivian |
| Minimum | 56.3% | 65.5% |
| Maximum | 100.0% | 100.0% |
| Range | 43.7% | 34.5% |
| Mean | 87.1% | 87.8% |
| Median | 86.5% | 86.9% |
| Interquartile 25% (IQ1) | 84.4% | 84.8% |
| Interquartile 75% (IQ3) | 90.3% | 91.1% |
| Interquartile Range (IQR) | 6.0% | 6.3% |
| Standard Deviation (Sample) | 7.6% | 6.9% |
| Standard Deviation (Population) | 7.5% | 6.9% |
Similar Demographics by In Labor Force | Age 25-29
Demographics Similar to Immigrants from Sierra Leone by In Labor Force | Age 25-29
In terms of in labor force | age 25-29, the demographic groups most similar to Immigrants from Sierra Leone are Macedonian (85.7%, a difference of 0.0%), Immigrants from India (85.7%, a difference of 0.010%), Immigrants from Eritrea (85.7%, a difference of 0.020%), Czech (85.6%, a difference of 0.030%), and Immigrants from Greece (85.7%, a difference of 0.060%).
| Demographics | Rating | Rank | In Labor Force | Age 25-29 |
| Sierra Leoneans | 99.9 /100 | #38 | Exceptional 85.8% |
| Croatians | 99.9 /100 | #39 | Exceptional 85.8% |
| Immigrants | Albania | 99.9 /100 | #40 | Exceptional 85.7% |
| Immigrants | Greece | 99.9 /100 | #41 | Exceptional 85.7% |
| Immigrants | Eritrea | 99.9 /100 | #42 | Exceptional 85.7% |
| Immigrants | India | 99.9 /100 | #43 | Exceptional 85.7% |
| Macedonians | 99.9 /100 | #44 | Exceptional 85.7% |
| Immigrants | Sierra Leone | 99.9 /100 | #45 | Exceptional 85.7% |
| Czechs | 99.8 /100 | #46 | Exceptional 85.6% |
| Turks | 99.8 /100 | #47 | Exceptional 85.6% |
| Italians | 99.8 /100 | #48 | Exceptional 85.6% |
| Swedes | 99.8 /100 | #49 | Exceptional 85.6% |
| Yugoslavians | 99.8 /100 | #50 | Exceptional 85.6% |
| Immigrants | Latvia | 99.8 /100 | #51 | Exceptional 85.6% |
| Immigrants | Poland | 99.7 /100 | #52 | Exceptional 85.6% |
Demographics Similar to Bolivians by In Labor Force | Age 25-29
In terms of in labor force | age 25-29, the demographic groups most similar to Bolivians are Latvian (86.1%, a difference of 0.0%), Immigrants from Bolivia (86.1%, a difference of 0.010%), Norwegian (86.1%, a difference of 0.030%), Immigrants from Lithuania (86.1%, a difference of 0.040%), and Immigrants from Ethiopia (86.1%, a difference of 0.050%).
| Demographics | Rating | Rank | In Labor Force | Age 25-29 |
| Immigrants | Cabo Verde | 100.0 /100 | #8 | Exceptional 86.2% |
| Ethiopians | 100.0 /100 | #9 | Exceptional 86.2% |
| Liberians | 100.0 /100 | #10 | Exceptional 86.1% |
| Immigrants | Ethiopia | 100.0 /100 | #11 | Exceptional 86.1% |
| Immigrants | Lithuania | 100.0 /100 | #12 | Exceptional 86.1% |
| Norwegians | 100.0 /100 | #13 | Exceptional 86.1% |
| Latvians | 100.0 /100 | #14 | Exceptional 86.1% |
| Bolivians | 100.0 /100 | #15 | Exceptional 86.1% |
| Immigrants | Bolivia | 100.0 /100 | #16 | Exceptional 86.1% |
| Bermudans | 100.0 /100 | #17 | Exceptional 86.0% |
| Bulgarians | 100.0 /100 | #18 | Exceptional 86.0% |
| Cape Verdeans | 100.0 /100 | #19 | Exceptional 86.0% |
| Immigrants | Ireland | 100.0 /100 | #20 | Exceptional 86.0% |
| Maltese | 100.0 /100 | #21 | Exceptional 86.0% |
| Cambodians | 100.0 /100 | #22 | Exceptional 86.0% |