Immigrants from Senegal vs Canadian In Labor Force | Age 25-29
COMPARE
Immigrants from Senegal
Canadian
In Labor Force | Age 25-29
In Labor Force | Age 25-29 Comparison
Immigrants from Senegal
Canadians
84.8%
IN LABOR FORCE | AGE 25-29
68.3/ 100
METRIC RATING
145th/ 347
METRIC RANK
84.7%
IN LABOR FORCE | AGE 25-29
58.5/ 100
METRIC RATING
161st/ 347
METRIC RANK
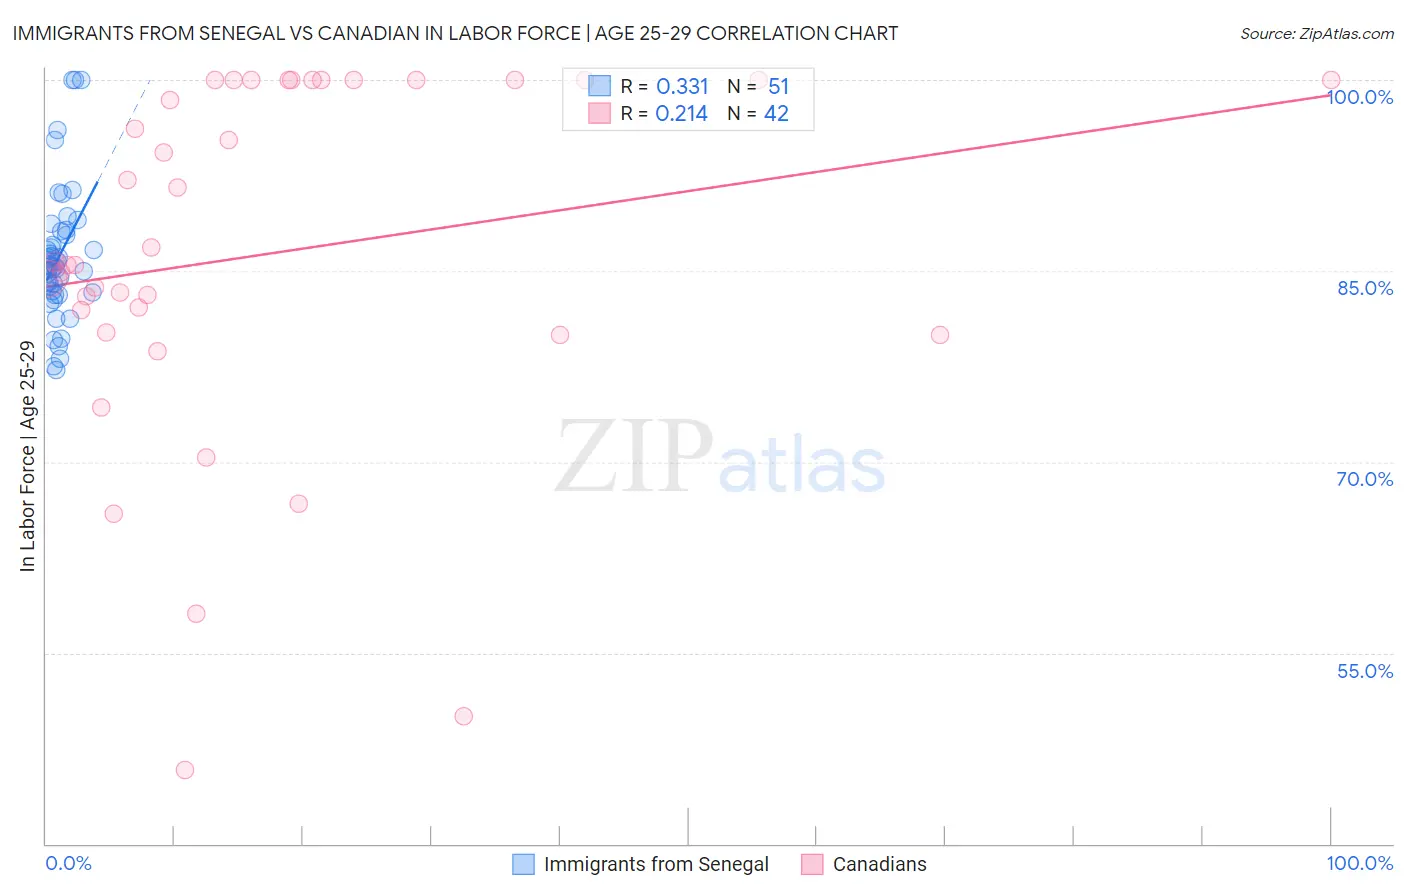
Immigrants from Senegal vs Canadian In Labor Force | Age 25-29 Correlation Chart
The statistical analysis conducted on geographies consisting of 90,123,722 people shows a mild positive correlation between the proportion of Immigrants from Senegal and labor force participation rate among population between the ages 25 and 29 in the United States with a correlation coefficient (R) of 0.331 and weighted average of 84.8%. Similarly, the statistical analysis conducted on geographies consisting of 437,288,132 people shows a weak positive correlation between the proportion of Canadians and labor force participation rate among population between the ages 25 and 29 in the United States with a correlation coefficient (R) of 0.214 and weighted average of 84.7%, a difference of 0.080%.
In Labor Force | Age 25-29 Correlation Summary
| Measurement | Immigrants from Senegal | Canadian |
| Minimum | 77.2% | 45.8% |
| Maximum | 100.0% | 100.0% |
| Range | 22.8% | 54.2% |
| Mean | 86.1% | 86.4% |
| Median | 85.4% | 85.6% |
| Interquartile 25% (IQ1) | 83.3% | 80.2% |
| Interquartile 75% (IQ3) | 88.1% | 100.0% |
| Interquartile Range (IQR) | 4.8% | 19.8% |
| Standard Deviation (Sample) | 5.2% | 14.1% |
| Standard Deviation (Population) | 5.2% | 13.9% |
Demographics Similar to Immigrants from Senegal and Canadians by In Labor Force | Age 25-29
In terms of in labor force | age 25-29, the demographic groups most similar to Immigrants from Senegal are Icelander (84.8%, a difference of 0.0%), Immigrants from Asia (84.8%, a difference of 0.0%), Sri Lankan (84.8%, a difference of 0.010%), Immigrants from Laos (84.8%, a difference of 0.010%), and Immigrants from England (84.7%, a difference of 0.030%). Similarly, the demographic groups most similar to Canadians are Immigrants from Peru (84.7%, a difference of 0.0%), Immigrants from Colombia (84.7%, a difference of 0.0%), Argentinean (84.7%, a difference of 0.0%), British (84.7%, a difference of 0.010%), and Immigrants from Ghana (84.7%, a difference of 0.010%).
| Demographics | Rating | Rank | In Labor Force | Age 25-29 |
| Sri Lankans | 69.2 /100 | #143 | Good 84.8% |
| Immigrants | Laos | 69.0 /100 | #144 | Good 84.8% |
| Immigrants | Senegal | 68.3 /100 | #145 | Good 84.8% |
| Icelanders | 68.2 /100 | #146 | Good 84.8% |
| Immigrants | Asia | 68.2 /100 | #147 | Good 84.8% |
| Immigrants | England | 65.2 /100 | #148 | Good 84.7% |
| Peruvians | 64.7 /100 | #149 | Good 84.7% |
| Swiss | 64.7 /100 | #150 | Good 84.7% |
| Colombians | 62.8 /100 | #151 | Good 84.7% |
| Immigrants | Pakistan | 62.7 /100 | #152 | Good 84.7% |
| Immigrants | Taiwan | 62.2 /100 | #153 | Good 84.7% |
| Immigrants | Sri Lanka | 61.7 /100 | #154 | Good 84.7% |
| Indians (Asian) | 61.6 /100 | #155 | Good 84.7% |
| French | 61.0 /100 | #156 | Good 84.7% |
| British | 60.4 /100 | #157 | Good 84.7% |
| Immigrants | Ghana | 60.2 /100 | #158 | Good 84.7% |
| Immigrants | Western Africa | 60.1 /100 | #159 | Good 84.7% |
| Immigrants | Peru | 58.6 /100 | #160 | Average 84.7% |
| Canadians | 58.5 /100 | #161 | Average 84.7% |
| Immigrants | Colombia | 58.3 /100 | #162 | Average 84.7% |
| Argentineans | 57.9 /100 | #163 | Average 84.7% |