Immigrants from Romania vs Immigrants from Ghana In Labor Force | Age 30-34
COMPARE
Immigrants from Romania
Immigrants from Ghana
In Labor Force | Age 30-34
In Labor Force | Age 30-34 Comparison
Immigrants from Romania
Immigrants from Ghana
85.1%
IN LABOR FORCE | AGE 30-34
94.7/ 100
METRIC RATING
113th/ 347
METRIC RANK
85.2%
IN LABOR FORCE | AGE 30-34
96.5/ 100
METRIC RATING
104th/ 347
METRIC RANK
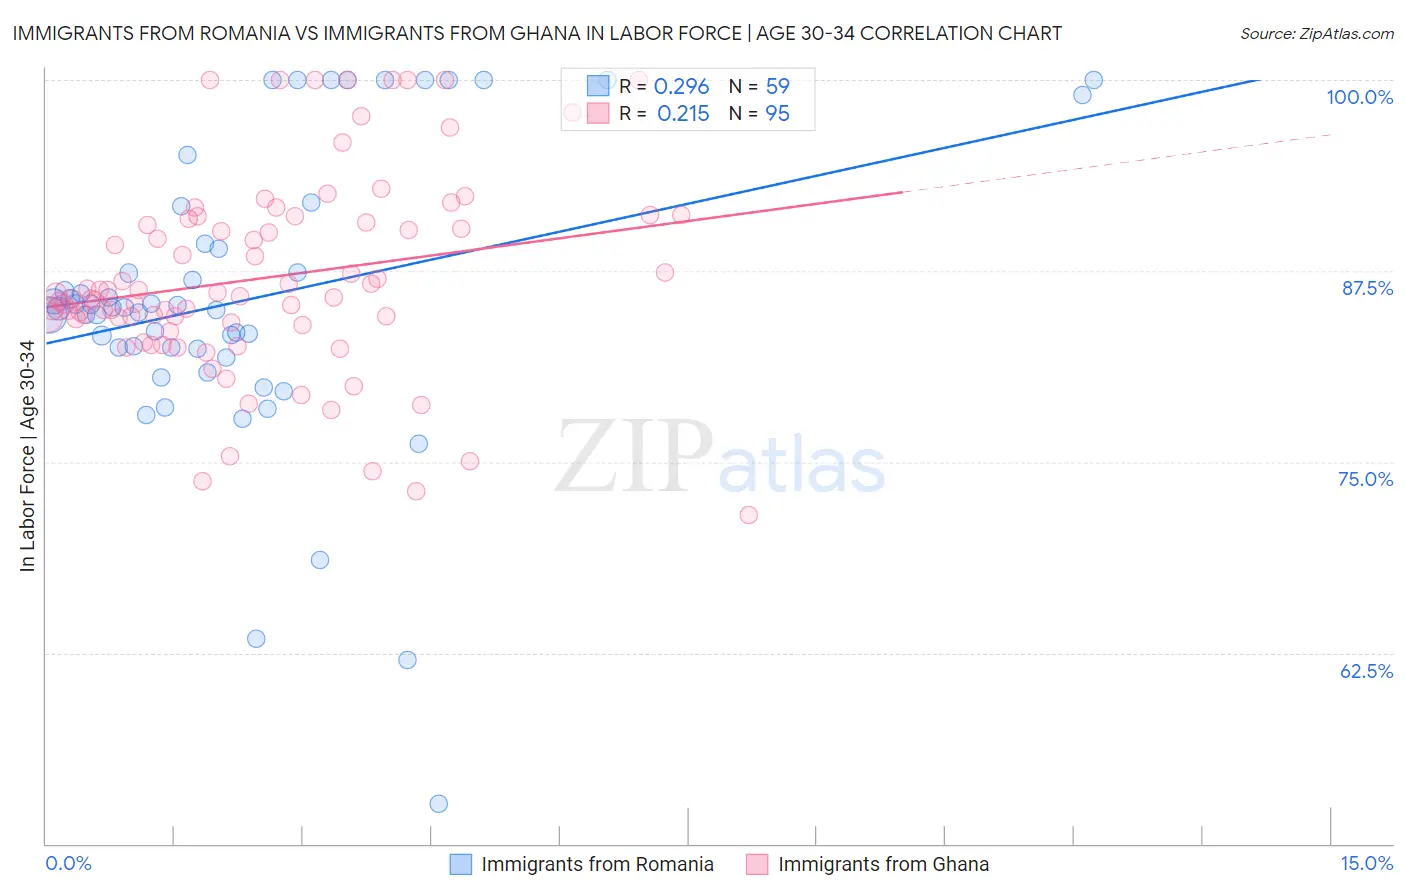
Immigrants from Romania vs Immigrants from Ghana In Labor Force | Age 30-34 Correlation Chart
The statistical analysis conducted on geographies consisting of 256,938,497 people shows a weak positive correlation between the proportion of Immigrants from Romania and labor force participation rate among population between the ages 30 and 34 in the United States with a correlation coefficient (R) of 0.296 and weighted average of 85.1%. Similarly, the statistical analysis conducted on geographies consisting of 199,865,631 people shows a weak positive correlation between the proportion of Immigrants from Ghana and labor force participation rate among population between the ages 30 and 34 in the United States with a correlation coefficient (R) of 0.215 and weighted average of 85.2%, a difference of 0.080%.
In Labor Force | Age 30-34 Correlation Summary
| Measurement | Immigrants from Romania | Immigrants from Ghana |
| Minimum | 52.6% | 71.5% |
| Maximum | 100.0% | 100.0% |
| Range | 47.4% | 28.5% |
| Mean | 85.6% | 87.0% |
| Median | 85.1% | 85.8% |
| Interquartile 25% (IQ1) | 82.4% | 84.1% |
| Interquartile 75% (IQ3) | 89.2% | 90.9% |
| Interquartile Range (IQR) | 6.9% | 6.8% |
| Standard Deviation (Sample) | 9.6% | 6.4% |
| Standard Deviation (Population) | 9.6% | 6.4% |
Demographics Similar to Immigrants from Romania and Immigrants from Ghana by In Labor Force | Age 30-34
In terms of in labor force | age 30-34, the demographic groups most similar to Immigrants from Romania are Immigrants from Hungary (85.1%, a difference of 0.0%), Yugoslavian (85.1%, a difference of 0.0%), Immigrants from South Central Asia (85.1%, a difference of 0.0%), Immigrants from Scotland (85.1%, a difference of 0.010%), and Egyptian (85.1%, a difference of 0.010%). Similarly, the demographic groups most similar to Immigrants from Ghana are Ukrainian (85.2%, a difference of 0.0%), Immigrants from Austria (85.2%, a difference of 0.010%), Alsatian (85.2%, a difference of 0.010%), Immigrants from Middle Africa (85.2%, a difference of 0.010%), and Immigrants from Northern Africa (85.2%, a difference of 0.010%).
| Demographics | Rating | Rank | In Labor Force | Age 30-34 |
| Immigrants | Uganda | 97.2 /100 | #98 | Exceptional 85.2% |
| Belgians | 97.2 /100 | #99 | Exceptional 85.2% |
| Sudanese | 97.1 /100 | #100 | Exceptional 85.2% |
| Immigrants | Belarus | 96.9 /100 | #101 | Exceptional 85.2% |
| Immigrants | Austria | 96.8 /100 | #102 | Exceptional 85.2% |
| Ukrainians | 96.6 /100 | #103 | Exceptional 85.2% |
| Immigrants | Ghana | 96.5 /100 | #104 | Exceptional 85.2% |
| Alsatians | 96.3 /100 | #105 | Exceptional 85.2% |
| Immigrants | Middle Africa | 96.3 /100 | #106 | Exceptional 85.2% |
| Immigrants | Northern Africa | 96.3 /100 | #107 | Exceptional 85.2% |
| Immigrants | Zimbabwe | 95.8 /100 | #108 | Exceptional 85.1% |
| Argentineans | 95.8 /100 | #109 | Exceptional 85.1% |
| Immigrants | South Africa | 95.3 /100 | #110 | Exceptional 85.1% |
| Immigrants | Scotland | 94.9 /100 | #111 | Exceptional 85.1% |
| Immigrants | Hungary | 94.8 /100 | #112 | Exceptional 85.1% |
| Immigrants | Romania | 94.7 /100 | #113 | Exceptional 85.1% |
| Yugoslavians | 94.7 /100 | #114 | Exceptional 85.1% |
| Immigrants | South Central Asia | 94.6 /100 | #115 | Exceptional 85.1% |
| Egyptians | 94.5 /100 | #116 | Exceptional 85.1% |
| Immigrants | Denmark | 94.3 /100 | #117 | Exceptional 85.1% |
| Immigrants | Malaysia | 94.2 /100 | #118 | Exceptional 85.1% |