Immigrants from Philippines vs Immigrants from Iran In Labor Force | Age 45-54
COMPARE
Immigrants from Philippines
Immigrants from Iran
In Labor Force | Age 45-54
In Labor Force | Age 45-54 Comparison
Immigrants from Philippines
Immigrants from Iran
82.9%
IN LABOR FORCE | AGE 45-54
69.0/ 100
METRIC RATING
155th/ 347
METRIC RANK
83.1%
IN LABOR FORCE | AGE 45-54
87.2/ 100
METRIC RATING
125th/ 347
METRIC RANK
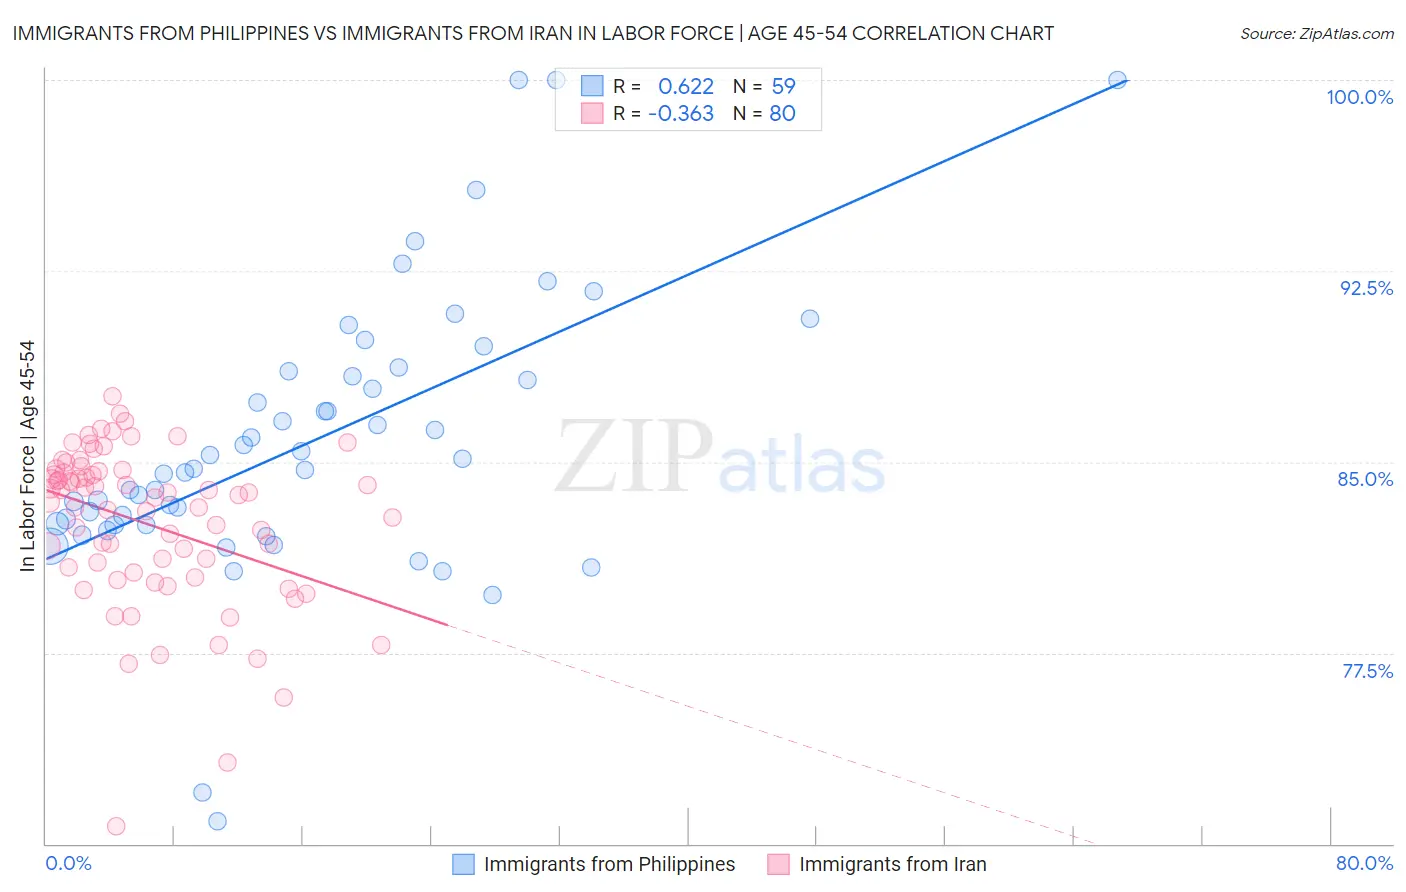
Immigrants from Philippines vs Immigrants from Iran In Labor Force | Age 45-54 Correlation Chart
The statistical analysis conducted on geographies consisting of 471,007,870 people shows a significant positive correlation between the proportion of Immigrants from Philippines and labor force participation rate among population between the ages 45 and 54 in the United States with a correlation coefficient (R) of 0.622 and weighted average of 82.9%. Similarly, the statistical analysis conducted on geographies consisting of 279,820,433 people shows a mild negative correlation between the proportion of Immigrants from Iran and labor force participation rate among population between the ages 45 and 54 in the United States with a correlation coefficient (R) of -0.363 and weighted average of 83.1%, a difference of 0.25%.
In Labor Force | Age 45-54 Correlation Summary
| Measurement | Immigrants from Philippines | Immigrants from Iran |
| Minimum | 70.9% | 70.7% |
| Maximum | 100.0% | 87.6% |
| Range | 29.1% | 16.9% |
| Mean | 85.8% | 82.6% |
| Median | 84.7% | 83.7% |
| Interquartile 25% (IQ1) | 82.5% | 80.8% |
| Interquartile 75% (IQ3) | 88.6% | 84.6% |
| Interquartile Range (IQR) | 6.0% | 3.9% |
| Standard Deviation (Sample) | 5.5% | 3.1% |
| Standard Deviation (Population) | 5.5% | 3.1% |
Similar Demographics by In Labor Force | Age 45-54
Demographics Similar to Immigrants from Philippines by In Labor Force | Age 45-54
In terms of in labor force | age 45-54, the demographic groups most similar to Immigrants from Philippines are Immigrants from Saudi Arabia (82.9%, a difference of 0.0%), Immigrants from Ghana (82.9%, a difference of 0.010%), Immigrants from Australia (82.9%, a difference of 0.010%), Immigrants from Southern Europe (82.9%, a difference of 0.010%), and Immigrants from Indonesia (82.9%, a difference of 0.020%).
| Demographics | Rating | Rank | In Labor Force | Age 45-54 |
| Immigrants | Nigeria | 74.1 /100 | #148 | Good 83.0% |
| Immigrants | Sweden | 73.3 /100 | #149 | Good 82.9% |
| Immigrants | Netherlands | 72.6 /100 | #150 | Good 82.9% |
| Koreans | 71.9 /100 | #151 | Good 82.9% |
| Slavs | 71.5 /100 | #152 | Good 82.9% |
| Immigrants | Indonesia | 70.6 /100 | #153 | Good 82.9% |
| Immigrants | Ghana | 70.3 /100 | #154 | Good 82.9% |
| Immigrants | Philippines | 69.0 /100 | #155 | Good 82.9% |
| Immigrants | Saudi Arabia | 68.8 /100 | #156 | Good 82.9% |
| Immigrants | Australia | 68.2 /100 | #157 | Good 82.9% |
| Immigrants | Southern Europe | 67.8 /100 | #158 | Good 82.9% |
| Immigrants | Austria | 64.6 /100 | #159 | Good 82.9% |
| Laotians | 62.8 /100 | #160 | Good 82.9% |
| South American Indians | 62.2 /100 | #161 | Good 82.9% |
| Haitians | 61.8 /100 | #162 | Good 82.8% |
Demographics Similar to Immigrants from Iran by In Labor Force | Age 45-54
In terms of in labor force | age 45-54, the demographic groups most similar to Immigrants from Iran are Tongan (83.1%, a difference of 0.020%), Bermudan (83.1%, a difference of 0.020%), Immigrants from Belgium (83.1%, a difference of 0.020%), Immigrants from Vietnam (83.1%, a difference of 0.030%), and Uruguayan (83.1%, a difference of 0.040%).
| Demographics | Rating | Rank | In Labor Force | Age 45-54 |
| Immigrants | Europe | 90.7 /100 | #118 | Exceptional 83.2% |
| Immigrants | Uruguay | 90.2 /100 | #119 | Exceptional 83.2% |
| Immigrants | Russia | 90.1 /100 | #120 | Exceptional 83.2% |
| Uruguayans | 89.4 /100 | #121 | Excellent 83.1% |
| Immigrants | Vietnam | 88.9 /100 | #122 | Excellent 83.1% |
| Tongans | 88.2 /100 | #123 | Excellent 83.1% |
| Bermudans | 88.0 /100 | #124 | Excellent 83.1% |
| Immigrants | Iran | 87.2 /100 | #125 | Excellent 83.1% |
| Immigrants | Belgium | 86.4 /100 | #126 | Excellent 83.1% |
| Immigrants | Jordan | 85.2 /100 | #127 | Excellent 83.1% |
| Germans | 85.1 /100 | #128 | Excellent 83.1% |
| Immigrants | Northern Europe | 85.1 /100 | #129 | Excellent 83.1% |
| Immigrants | Israel | 84.7 /100 | #130 | Excellent 83.1% |
| Finns | 83.3 /100 | #131 | Excellent 83.1% |
| Immigrants | Ukraine | 82.9 /100 | #132 | Excellent 83.0% |