Immigrants from Philippines vs Croatian In Labor Force | Age 45-54
COMPARE
Immigrants from Philippines
Croatian
In Labor Force | Age 45-54
In Labor Force | Age 45-54 Comparison
Immigrants from Philippines
Croatians
82.9%
IN LABOR FORCE | AGE 45-54
69.0/ 100
METRIC RATING
155th/ 347
METRIC RANK
83.6%
IN LABOR FORCE | AGE 45-54
99.0/ 100
METRIC RATING
47th/ 347
METRIC RANK
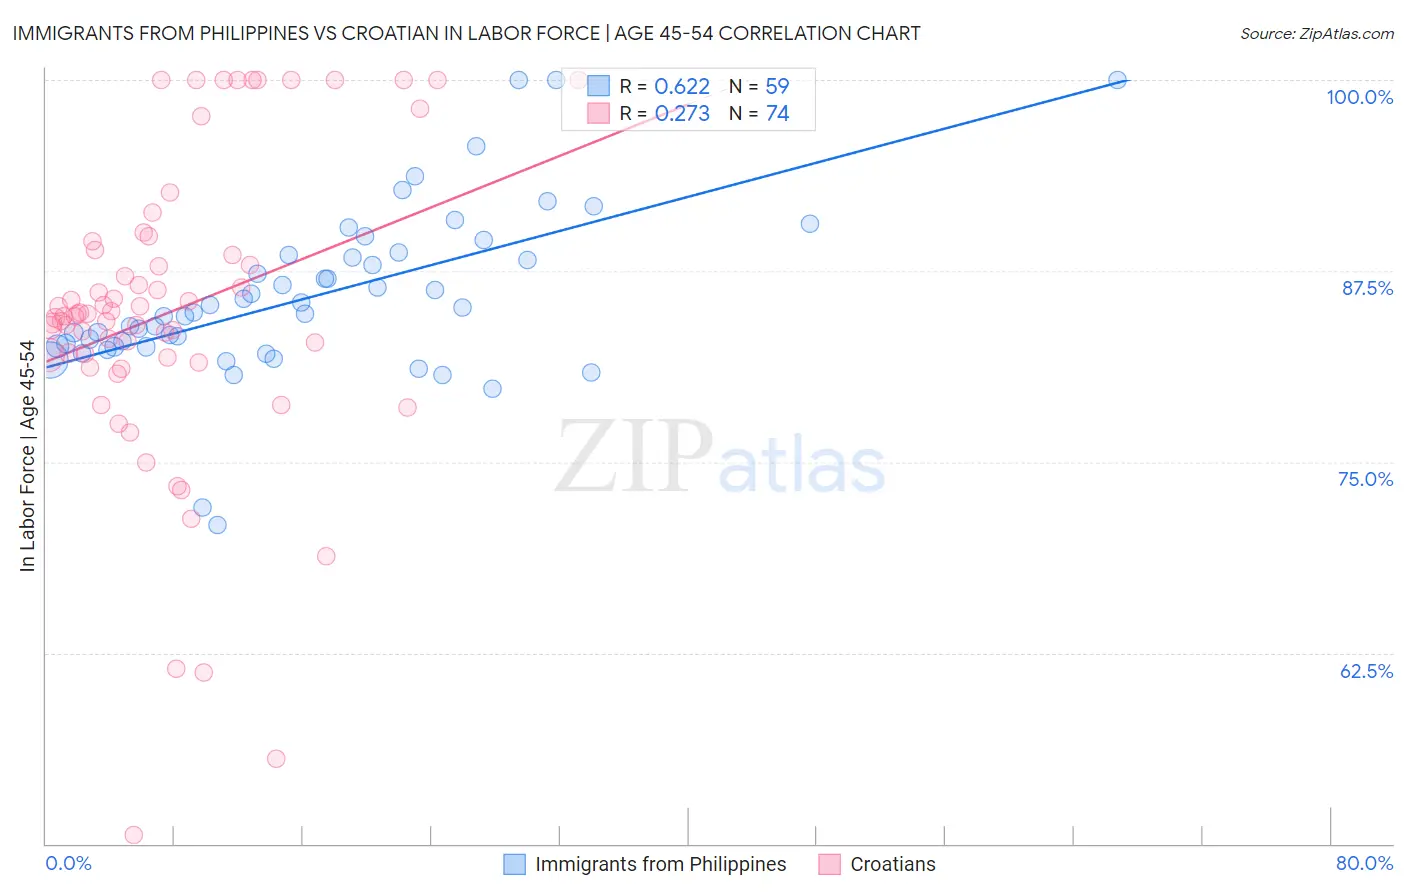
Immigrants from Philippines vs Croatian In Labor Force | Age 45-54 Correlation Chart
The statistical analysis conducted on geographies consisting of 471,007,870 people shows a significant positive correlation between the proportion of Immigrants from Philippines and labor force participation rate among population between the ages 45 and 54 in the United States with a correlation coefficient (R) of 0.622 and weighted average of 82.9%. Similarly, the statistical analysis conducted on geographies consisting of 375,518,323 people shows a weak positive correlation between the proportion of Croatians and labor force participation rate among population between the ages 45 and 54 in the United States with a correlation coefficient (R) of 0.273 and weighted average of 83.6%, a difference of 0.83%.
In Labor Force | Age 45-54 Correlation Summary
| Measurement | Immigrants from Philippines | Croatian |
| Minimum | 70.9% | 50.6% |
| Maximum | 100.0% | 100.0% |
| Range | 29.1% | 49.4% |
| Mean | 85.8% | 84.8% |
| Median | 84.7% | 84.6% |
| Interquartile 25% (IQ1) | 82.5% | 81.8% |
| Interquartile 75% (IQ3) | 88.6% | 88.9% |
| Interquartile Range (IQR) | 6.0% | 7.0% |
| Standard Deviation (Sample) | 5.5% | 10.1% |
| Standard Deviation (Population) | 5.5% | 10.0% |
Similar Demographics by In Labor Force | Age 45-54
Demographics Similar to Immigrants from Philippines by In Labor Force | Age 45-54
In terms of in labor force | age 45-54, the demographic groups most similar to Immigrants from Philippines are Immigrants from Saudi Arabia (82.9%, a difference of 0.0%), Immigrants from Ghana (82.9%, a difference of 0.010%), Immigrants from Australia (82.9%, a difference of 0.010%), Immigrants from Southern Europe (82.9%, a difference of 0.010%), and Immigrants from Indonesia (82.9%, a difference of 0.020%).
| Demographics | Rating | Rank | In Labor Force | Age 45-54 |
| Immigrants | Nigeria | 74.1 /100 | #148 | Good 83.0% |
| Immigrants | Sweden | 73.3 /100 | #149 | Good 82.9% |
| Immigrants | Netherlands | 72.6 /100 | #150 | Good 82.9% |
| Koreans | 71.9 /100 | #151 | Good 82.9% |
| Slavs | 71.5 /100 | #152 | Good 82.9% |
| Immigrants | Indonesia | 70.6 /100 | #153 | Good 82.9% |
| Immigrants | Ghana | 70.3 /100 | #154 | Good 82.9% |
| Immigrants | Philippines | 69.0 /100 | #155 | Good 82.9% |
| Immigrants | Saudi Arabia | 68.8 /100 | #156 | Good 82.9% |
| Immigrants | Australia | 68.2 /100 | #157 | Good 82.9% |
| Immigrants | Southern Europe | 67.8 /100 | #158 | Good 82.9% |
| Immigrants | Austria | 64.6 /100 | #159 | Good 82.9% |
| Laotians | 62.8 /100 | #160 | Good 82.9% |
| South American Indians | 62.2 /100 | #161 | Good 82.9% |
| Haitians | 61.8 /100 | #162 | Good 82.8% |
Demographics Similar to Croatians by In Labor Force | Age 45-54
In terms of in labor force | age 45-54, the demographic groups most similar to Croatians are Lithuanian (83.6%, a difference of 0.010%), Immigrants from Poland (83.6%, a difference of 0.010%), Immigrants from Morocco (83.6%, a difference of 0.010%), Immigrants from Hong Kong (83.6%, a difference of 0.020%), and Burmese (83.6%, a difference of 0.030%).
| Demographics | Rating | Rank | In Labor Force | Age 45-54 |
| Immigrants | Uganda | 99.4 /100 | #40 | Exceptional 83.7% |
| Immigrants | Korea | 99.3 /100 | #41 | Exceptional 83.7% |
| Immigrants | Moldova | 99.3 /100 | #42 | Exceptional 83.7% |
| Venezuelans | 99.2 /100 | #43 | Exceptional 83.6% |
| Burmese | 99.1 /100 | #44 | Exceptional 83.6% |
| Immigrants | Hong Kong | 99.1 /100 | #45 | Exceptional 83.6% |
| Lithuanians | 99.1 /100 | #46 | Exceptional 83.6% |
| Croatians | 99.0 /100 | #47 | Exceptional 83.6% |
| Immigrants | Poland | 99.0 /100 | #48 | Exceptional 83.6% |
| Immigrants | Morocco | 99.0 /100 | #49 | Exceptional 83.6% |
| Immigrants | Greece | 98.8 /100 | #50 | Exceptional 83.6% |
| Immigrants | Turkey | 98.8 /100 | #51 | Exceptional 83.6% |
| Poles | 98.7 /100 | #52 | Exceptional 83.6% |
| Peruvians | 98.7 /100 | #53 | Exceptional 83.6% |
| Somalis | 98.7 /100 | #54 | Exceptional 83.5% |