Immigrants from Nepal vs Luxembourger Householder Income Ages 25 - 44 years
COMPARE
Immigrants from Nepal
Luxembourger
Householder Income Ages 25 - 44 years
Householder Income Ages 25 - 44 years Comparison
Immigrants from Nepal
Luxembourgers
$95,322
HOUSEHOLDER INCOME AGES 25 - 44 YEARS
60.3/ 100
METRIC RATING
165th/ 347
METRIC RANK
$97,237
HOUSEHOLDER INCOME AGES 25 - 44 YEARS
81.5/ 100
METRIC RATING
141st/ 347
METRIC RANK
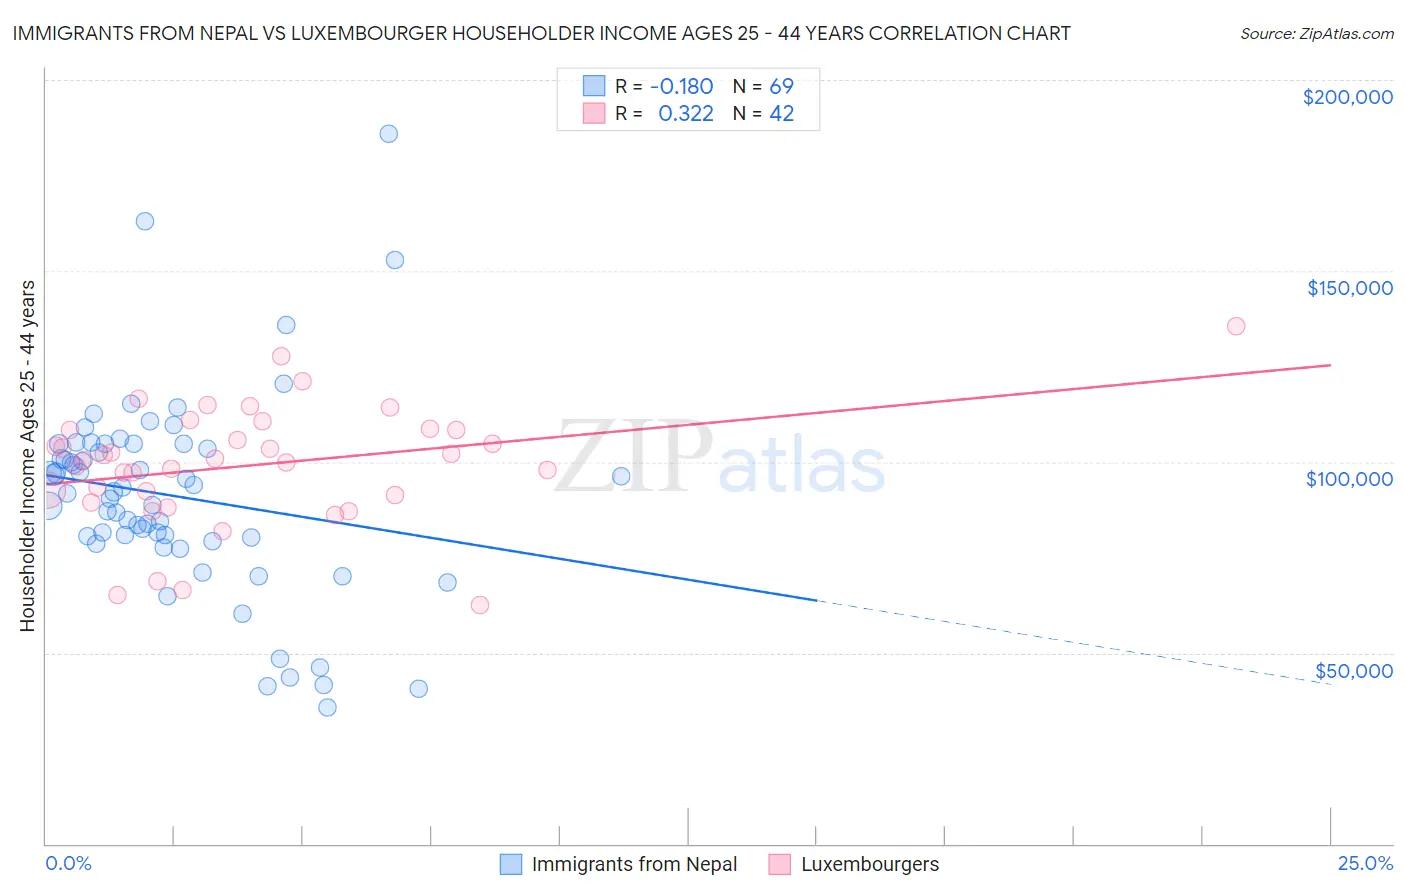
Immigrants from Nepal vs Luxembourger Householder Income Ages 25 - 44 years Correlation Chart
The statistical analysis conducted on geographies consisting of 186,599,325 people shows a poor negative correlation between the proportion of Immigrants from Nepal and household income with householder between the ages 25 and 44 in the United States with a correlation coefficient (R) of -0.180 and weighted average of $95,322. Similarly, the statistical analysis conducted on geographies consisting of 144,399,527 people shows a mild positive correlation between the proportion of Luxembourgers and household income with householder between the ages 25 and 44 in the United States with a correlation coefficient (R) of 0.322 and weighted average of $97,237, a difference of 2.0%.
Householder Income Ages 25 - 44 years Correlation Summary
| Measurement | Immigrants from Nepal | Luxembourger |
| Minimum | $35,521 | $62,500 |
| Maximum | $185,946 | $135,353 |
| Range | $150,425 | $72,853 |
| Mean | $91,020 | $99,089 |
| Median | $92,147 | $100,624 |
| Interquartile 25% (IQ1) | $79,685 | $91,375 |
| Interquartile 75% (IQ3) | $104,696 | $108,286 |
| Interquartile Range (IQR) | $25,011 | $16,911 |
| Standard Deviation (Sample) | $26,432 | $15,610 |
| Standard Deviation (Population) | $26,240 | $15,424 |
Similar Demographics by Householder Income Ages 25 - 44 years
Demographics Similar to Immigrants from Nepal by Householder Income Ages 25 - 44 years
In terms of householder income ages 25 - 44 years, the demographic groups most similar to Immigrants from Nepal are South American ($95,362, a difference of 0.040%), Immigrants from Ethiopia ($95,256, a difference of 0.070%), Immigrants from Saudi Arabia ($95,450, a difference of 0.13%), Immigrants from Portugal ($95,512, a difference of 0.20%), and Swiss ($95,511, a difference of 0.20%).
| Demographics | Rating | Rank | Householder Income Ages 25 - 44 years |
| Scandinavians | 63.9 /100 | #158 | Good $95,596 |
| Costa Ricans | 63.5 /100 | #159 | Good $95,565 |
| Icelanders | 63.4 /100 | #160 | Good $95,560 |
| Immigrants | Portugal | 62.8 /100 | #161 | Good $95,512 |
| Swiss | 62.8 /100 | #162 | Good $95,511 |
| Immigrants | Saudi Arabia | 62.0 /100 | #163 | Good $95,450 |
| South Americans | 60.9 /100 | #164 | Good $95,362 |
| Immigrants | Nepal | 60.3 /100 | #165 | Good $95,322 |
| Immigrants | Ethiopia | 59.5 /100 | #166 | Average $95,256 |
| Czechoslovakians | 57.0 /100 | #167 | Average $95,070 |
| Alsatians | 56.8 /100 | #168 | Average $95,059 |
| Native Hawaiians | 56.8 /100 | #169 | Average $95,058 |
| Slovaks | 56.4 /100 | #170 | Average $95,032 |
| Immigrants | Armenia | 54.2 /100 | #171 | Average $94,867 |
| Scottish | 50.8 /100 | #172 | Average $94,622 |
Demographics Similar to Luxembourgers by Householder Income Ages 25 - 44 years
In terms of householder income ages 25 - 44 years, the demographic groups most similar to Luxembourgers are Danish ($97,221, a difference of 0.020%), Immigrants from Jordan ($97,185, a difference of 0.050%), Immigrants from Morocco ($97,305, a difference of 0.070%), Immigrants from Chile ($97,159, a difference of 0.080%), and Immigrants from Peru ($97,329, a difference of 0.090%).
| Demographics | Rating | Rank | Householder Income Ages 25 - 44 years |
| Canadians | 84.5 /100 | #134 | Excellent $97,625 |
| Immigrants | Oceania | 84.5 /100 | #135 | Excellent $97,623 |
| Hungarians | 83.9 /100 | #136 | Excellent $97,544 |
| Lebanese | 82.3 /100 | #137 | Excellent $97,339 |
| Arabs | 82.3 /100 | #138 | Excellent $97,336 |
| Immigrants | Peru | 82.2 /100 | #139 | Excellent $97,329 |
| Immigrants | Morocco | 82.0 /100 | #140 | Excellent $97,305 |
| Luxembourgers | 81.5 /100 | #141 | Excellent $97,237 |
| Danes | 81.3 /100 | #142 | Excellent $97,221 |
| Immigrants | Jordan | 81.0 /100 | #143 | Excellent $97,185 |
| Immigrants | Chile | 80.8 /100 | #144 | Excellent $97,159 |
| Norwegians | 78.2 /100 | #145 | Good $96,866 |
| Ethiopians | 77.8 /100 | #146 | Good $96,824 |
| Immigrants | Syria | 77.4 /100 | #147 | Good $96,789 |
| Irish | 76.9 /100 | #148 | Good $96,730 |