Immigrants from Malaysia vs Immigrants from China In Labor Force | Age 45-54
COMPARE
Immigrants from Malaysia
Immigrants from China
In Labor Force | Age 45-54
In Labor Force | Age 45-54 Comparison
Immigrants from Malaysia
Immigrants from China
83.2%
IN LABOR FORCE | AGE 45-54
91.4/ 100
METRIC RATING
116th/ 347
METRIC RANK
83.2%
IN LABOR FORCE | AGE 45-54
90.9/ 100
METRIC RATING
117th/ 347
METRIC RANK
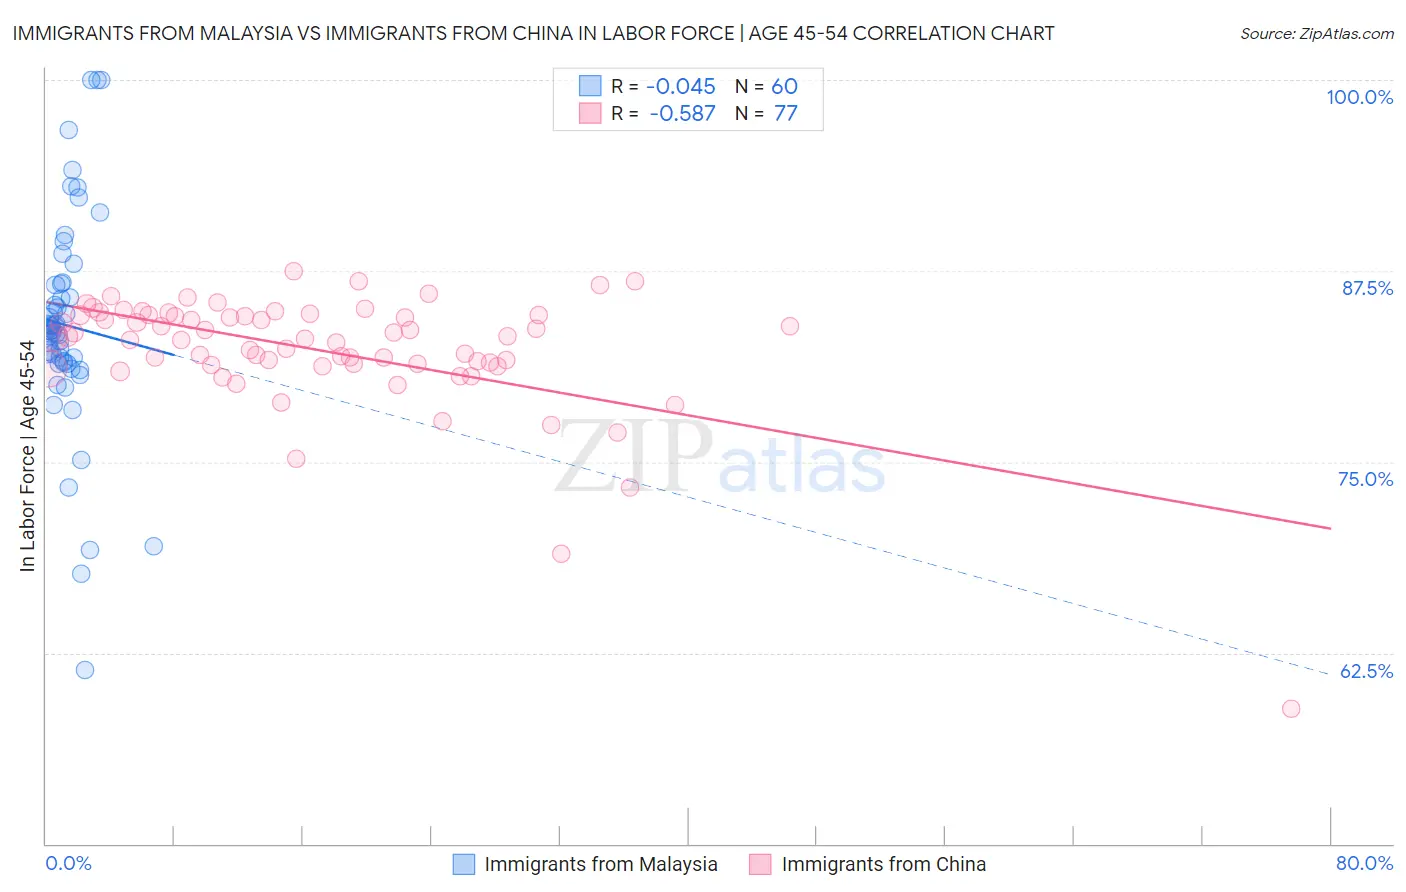
Immigrants from Malaysia vs Immigrants from China In Labor Force | Age 45-54 Correlation Chart
The statistical analysis conducted on geographies consisting of 197,919,693 people shows no correlation between the proportion of Immigrants from Malaysia and labor force participation rate among population between the ages 45 and 54 in the United States with a correlation coefficient (R) of -0.045 and weighted average of 83.2%. Similarly, the statistical analysis conducted on geographies consisting of 456,555,548 people shows a substantial negative correlation between the proportion of Immigrants from China and labor force participation rate among population between the ages 45 and 54 in the United States with a correlation coefficient (R) of -0.587 and weighted average of 83.2%, a difference of 0.010%.
In Labor Force | Age 45-54 Correlation Summary
| Measurement | Immigrants from Malaysia | Immigrants from China |
| Minimum | 61.4% | 58.8% |
| Maximum | 100.0% | 87.5% |
| Range | 38.6% | 28.7% |
| Mean | 83.9% | 82.3% |
| Median | 83.6% | 83.1% |
| Interquartile 25% (IQ1) | 81.5% | 81.4% |
| Interquartile 75% (IQ3) | 86.6% | 84.6% |
| Interquartile Range (IQR) | 5.1% | 3.3% |
| Standard Deviation (Sample) | 7.2% | 4.1% |
| Standard Deviation (Population) | 7.1% | 4.0% |
Demographics Similar to Immigrants from Malaysia and Immigrants from China by In Labor Force | Age 45-54
In terms of in labor force | age 45-54, the demographic groups most similar to Immigrants from Malaysia are Immigrants from Chile (83.2%, a difference of 0.0%), Immigrants from Albania (83.2%, a difference of 0.010%), Assyrian/Chaldean/Syriac (83.2%, a difference of 0.010%), Immigrants from Europe (83.2%, a difference of 0.020%), and Immigrants from Italy (83.2%, a difference of 0.030%). Similarly, the demographic groups most similar to Immigrants from China are Immigrants from Europe (83.2%, a difference of 0.010%), Assyrian/Chaldean/Syriac (83.2%, a difference of 0.020%), Immigrants from Chile (83.2%, a difference of 0.020%), Immigrants from Uruguay (83.2%, a difference of 0.020%), and Immigrants from Russia (83.2%, a difference of 0.020%).
| Demographics | Rating | Rank | In Labor Force | Age 45-54 |
| Sri Lankans | 93.2 /100 | #106 | Exceptional 83.2% |
| Iranians | 92.9 /100 | #107 | Exceptional 83.2% |
| Slovaks | 92.8 /100 | #108 | Exceptional 83.2% |
| Ukrainians | 92.7 /100 | #109 | Exceptional 83.2% |
| Immigrants | Africa | 92.6 /100 | #110 | Exceptional 83.2% |
| Immigrants | Italy | 92.5 /100 | #111 | Exceptional 83.2% |
| Immigrants | Afghanistan | 92.4 /100 | #112 | Exceptional 83.2% |
| Immigrants | Albania | 91.8 /100 | #113 | Exceptional 83.2% |
| Assyrians/Chaldeans/Syriacs | 91.7 /100 | #114 | Exceptional 83.2% |
| Immigrants | Chile | 91.6 /100 | #115 | Exceptional 83.2% |
| Immigrants | Malaysia | 91.4 /100 | #116 | Exceptional 83.2% |
| Immigrants | China | 90.9 /100 | #117 | Exceptional 83.2% |
| Immigrants | Europe | 90.7 /100 | #118 | Exceptional 83.2% |
| Immigrants | Uruguay | 90.2 /100 | #119 | Exceptional 83.2% |
| Immigrants | Russia | 90.1 /100 | #120 | Exceptional 83.2% |
| Uruguayans | 89.4 /100 | #121 | Excellent 83.1% |
| Immigrants | Vietnam | 88.9 /100 | #122 | Excellent 83.1% |
| Tongans | 88.2 /100 | #123 | Excellent 83.1% |
| Bermudans | 88.0 /100 | #124 | Excellent 83.1% |
| Immigrants | Iran | 87.2 /100 | #125 | Excellent 83.1% |
| Immigrants | Belgium | 86.4 /100 | #126 | Excellent 83.1% |